 Alexander Reelsen
Testing and Releasing Elasticsearch & the Elastic Stack
TLDR; This is a rather long blog post from one of my talks. This talk covers the different aspects of testing within Elasticsearch and sheds some light on how releases are done. Please grab a coffee and take all the time to read it. Also, ping me, when you have any questions. Happy to discuss!
Even though this talk can be found on YouTube, I think that that reading simplifies things a lot (and allows embedding links all the time), as you can go on your own pace, skip parts of it and it is easier to resume. If you still prefer the video, check out my presentations page and follow the links.
Also, I have removed a few slides, and replaced them with a couple of text paragraphs in some cases, should you be wondering why this post does not align with a presentation.
Lastly, one of my main goals of this post is to make you think of your own application and how you can improve your abilities to test and release.
Welcome to today’s session. We will cover different testing strategies within Elasticsearch, but also how a whole bunch of products and solutions is released at the same time.
Even though it may not look obvious, but going from a list of GitHub commits:
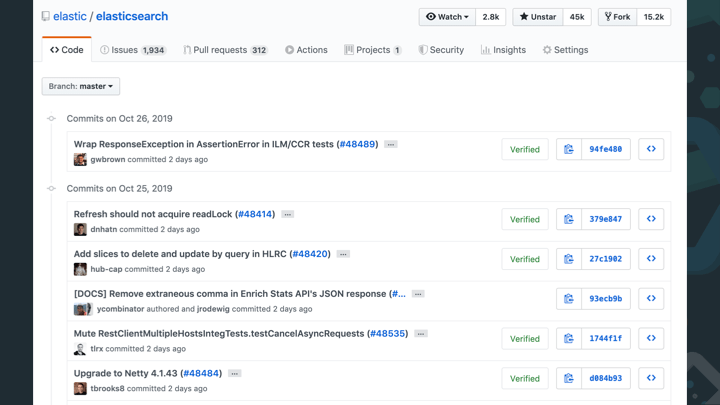
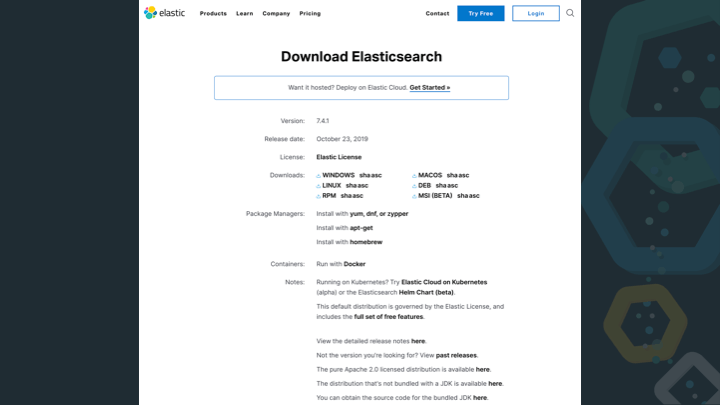
A release is a major effort, even though it may just look like a download page to you.
A proper release takes time, effort and consideration - and probably a well versed release manager.
Check out the Elasticsearch Download Page. This webpage alone shows a lot of things. 6 different distributions of Elasticsearch for different operating systems (Linux, MacOs, Windows) and different distribution formats (zip, RPM, DEB).
Right below there are three packaging archives mentioned with apt, yum and homebrew, each requiring a different preparation.
But even if all those releases work perfectly, there is more work to do. With Elastic Cloud in the mix, every new release should be available immediately.
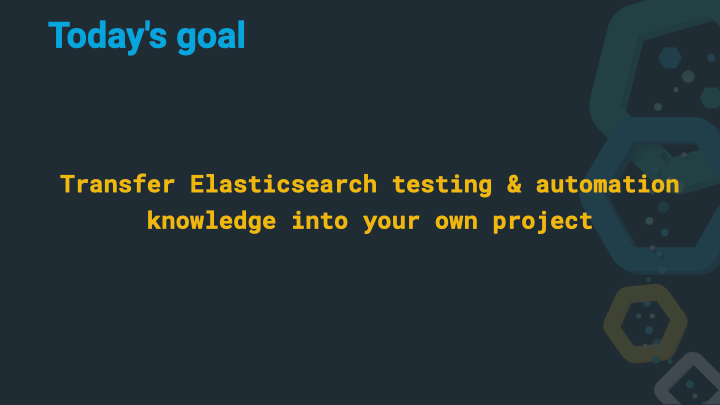
This post has a simple goal
Transfer Elasticsearch testing & automation knowledge into your own project
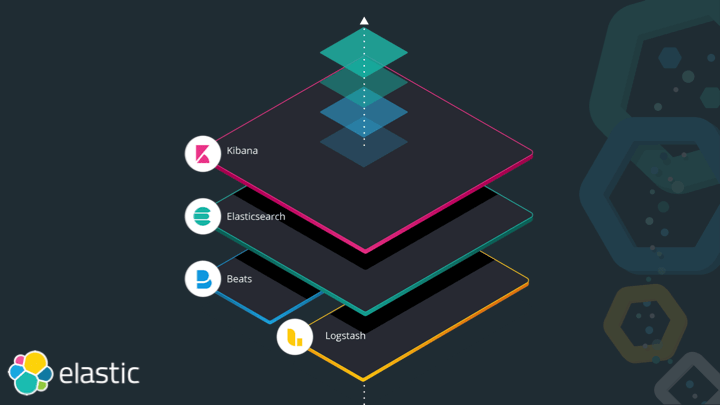
The Elastic Stack consists of Elasticsearch, Kibana, Beats and Logstash. Each of those serve a different purpose, with Elasticsearch being the heart of the stack, responsible for storing, querying and aggregating data. Kibana is the window into the stack and much more than a dashboarding tool nowadays, it features a ton of management and monitoring functionality built-in, ensuring you don’t need to be a wizard with the Elasticsearch API. In order to index data into Elasticsearch you can either roll your own tooling or use either Beats or Logstash. Logstash being a very generic ETL tool (to me it’s a very versatile Swiss army knife), while Beats are small and concise programs for a single use-case. In order to tail a log file and sent it over to Elasticsearch, you would use Filebeat, whereas for gathering system or service statistics you would go with Metricbeat.
In order to cover certain use cases, solutions are basically vertical slides across the stack, for example Observability with APM, Infrastructure and Service Monitoring that reuse parts of the stack like Machine Learning.
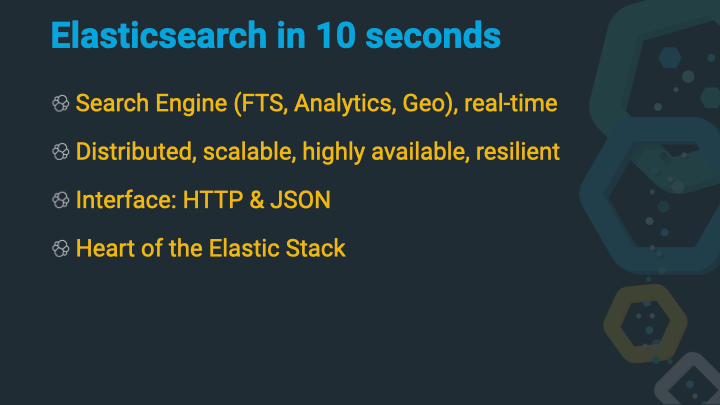
Let’s do a quick dive into Elasticsearch. On the outside, Elasticsearch is a
search engine, that can be used for classic full-text search (show me all
documents that contain brown shoes), analytics (group all documents found
by their category_id and return counts per category) or geo search (show
me all cars I can buy in a radius of fifty kilometers) - of course you can
combine all three together as well. All of this happens near real-time, so
the time between indexing data and making it available for search is usually
less than a second.
Elasticsearch is distributed, so you can run it on a single node, or hundreds of instances together as a cluster.
Elasticsearch is scalable, you can scale it up (buy faster hardware) or scale it out by adding more nodes.
Elasticsearch is highly available and resilient. So, what does this mean? If you add more nodes to a cluster, the likelihood of a single node failure increases. However, Elasticsearch will figure out a node failure by itself and also take the proper measures to ensure that your data is available as configured (more than one copy somewhere in the cluster), and thus you should not need to do any maintenance in case a node goes down.
The interface of Elasticsearch is HTTP & JSON - a protocol and an object notation that every developer hopefully knows about and has already dealt with.
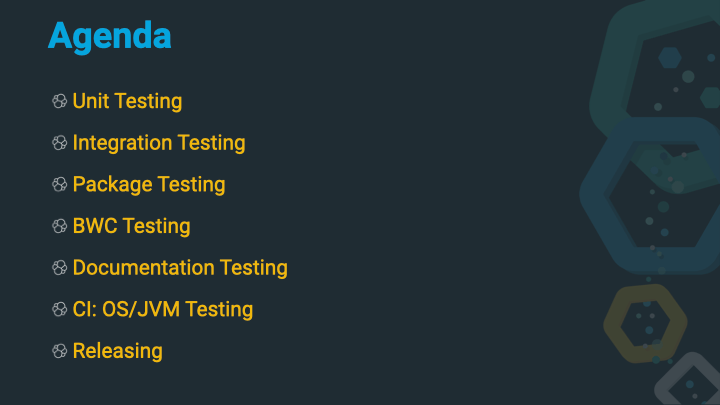
So, let’s take a look what will be covered in this post.
- Unit Testing: Fast and quick unit tests
- Integration Testing: Testing against a running Elasticsearch instance
- Package Testing: Ensuring that all the packages install/delete/upgrade properly
- BWC Testing: All recommended upgrade procedures should work as documented
- Documentation Testing: Documentation is code too!
- CI: OS/JVM Testing: Different JVMs need to be tested as well
- Releasing: The final step… or not?
Let’s start with the most fundamental test category - unit tests. Small in size and quick to run. Elasticsearch has a couple of interesting specialties for unit testing.
public class DateFormattersTests extends ESTestCase {

    public void testWeekBasedDates() {
        // as per WeekFields.ISO first week starts on Monday and
        // has minimum 4 days
        DateFormatter dateFormatter = DateFormatters.forPattern("YYYY-ww");

        ...
        // fancy assertions here
    }
}
Every test class extends from the ESTestCase class, which contains a lot
of setup for tests. You can also access an own logger if you need to. One
difference to a regular junit4 setup is the fact, that the @Test
annotation is not needed, but every test method needs to have a test
prefix.
/**
 * Base testcase for randomized unit testing with Elasticsearch
 */
@Listeners({
        ReproduceInfoPrinter.class,
        LoggingListener.class
})
@ThreadLeakScope(Scope.SUITE)
@ThreadLeakLingering(linger = 5000) // 5 sec lingering
@TimeoutSuite(millis = 20 * TimeUnits.MINUTE)
@LuceneTestCase.SuppressSysoutChecks(bugUrl = "we log a lot on purpose")
// we suppress pretty much all the lucene codecs for now, except asserting
// assertingcodec is the winner for a codec here: it finds bugs and gives
// clear exceptions.
@SuppressCodecs({
	"SimpleText", "Memory", "CheapBastard", "Direct", "Compressing",
	"FST50", "FSTOrd50", "TestBloomFilteredLucenePostings",
	"MockRandom", "BlockTreeOrds", "LuceneFixedGap",
	"LuceneVarGapFixedInterval", "LuceneVarGapDocFreqInterval",
	"Lucene50"
})
@LuceneTestCase.SuppressReproduceLine
public abstract class ESTestCase extends LuceneTestCase {
...
Woa! This looks almost like a JPA entity, with all these annotations. A few
of those are very Lucene specific like the @SuppressCodecs one. Others are
more generic and configure potential timeout for suite runs or thread leak
detection.
Let’s go deeper in the rabbit hole and look at the LuceneTestCase class,
full class here.
@RunWith(RandomizedRunner.class)
@TestMethodProviders({
  LuceneJUnit3MethodProvider.class,
  JUnit4MethodProvider.class
})
@Listeners({
  RunListenerPrintReproduceInfo.class,
  FailureMarker.class
})
@SeedDecorators({MixWithSuiteName.class}) // See LUCENE-3995 for rationale.
@ThreadLeakScope(Scope.SUITE)
@ThreadLeakGroup(Group.MAIN)
@ThreadLeakAction({Action.WARN, Action.INTERRUPT})
@ThreadLeakLingering(linger = 20000)
@ThreadLeakZombies(Consequence.IGNORE_REMAINING_TESTS)
@TimeoutSuite(millis = 2 * TimeUnits.HOUR)
@ThreadLeakFilters(defaultFilters = true, filters = {
    QuickPatchThreadsFilter.class
})
@TestRuleLimitSysouts.Limit(
    bytes = TestRuleLimitSysouts.DEFAULT_LIMIT,
    hardLimit = TestRuleLimitSysouts.DEFAULT_HARD_LIMIT)
public abstract class LuceneTestCase extends Assert {
Right at the top, we see some important information. The @RunWith()
annotation is used in junit to configure a specialized runner, and this is
what we’re after here.
Let’s check out the first comment in the RandomizedRunner class, full
class here.
/**
 * A {@link Runner} implementation for running randomized test cases with
 * predictable and repeatable randomness.
 *
 * <p>Supports the following JUnit4 features:
 * <ul>
 *   <li>{@link BeforeClass}-annotated methods (before all tests of a class/superclass),</li>
 *   <li>{@link Before}-annotated methods (before each test),</li>
 *   <li>{@link Test}-annotated methods,</li>
 *   <li>{@link After}-annotated methods (after each test),</li>
 *   <li>{@link AfterClass}-annotated methods (after all tests of a class/superclass),</li>
 *   <li>{@link Rule}-annotated fields implementing {@link org.junit.rules.MethodRule}
 *       and {@link TestRule}.</li>
 * </ul>
 *
...
Now this is interesting. Let’s reread the first sentence, stating randomized test cases with predictable and repeatable randomness. So, what sorcery is this?
It’s the randomized testing test runner which by default uses a random seed to create pseudo randomness, as this seed can be reused on test runs and this will yield the same random numbers. Even though this is a property you usually try to prevent at all costs, in this case it is a desirable property when running tests to ensure they are reproducible.
So, instead of using static data like a fixed string, you can use a random string with a certain length, or a random number within a certain range. The same applies for time zones or locales. This way, you are covering a broader range of test cases, just by running your tests repeatedly (no matter if local or in CI).
Let’s take a look at a few helper methods
String randomString = randomAlphaOfLength(10);
assertThat(randomString.length(), is(10));

boolean randomBoolean = randomBoolean();
assertThat(randomBoolean, is(anyOf(is(true), is(false))));

final Integer randomInt = randomFrom(1, 22, 11, 41, 58);
assertThat(randomInt,
           is(allOf(greaterThanOrEqualTo(1), lessThanOrEqualTo(58))));

final int randomIntBetween = randomIntBetween(1, 10);
assertThat(randomIntBetween,
           is(allOf(greaterThanOrEqualTo(1), lessThanOrEqualTo(10))));

final long nonNegativeLong = randomNonNegativeLong();
assertThat(nonNegativeLong, is(greaterThanOrEqualTo(0L)));

final ZoneId zoneId = randomZone();
assertThat(ZoneId.getAvailableZoneIds(), hasItem(zoneId.toString()));

final Locale locale = randomLocale(random());
assertThat(Arrays.asList(Locale.getAvailableLocales()), hasItem(locale));
So in what context can this be used? Let’s write a more real example:
public int add (int a, int b) {
    assert a > 0;
    assert b > 0;
    return a + b;
}
As you can guess, this is probably the most awesome method ever written. The
assertions only kick in if -ea is used as parameter for java, but that
will not be our problem. This could be a test for this method:
public void testAdd() {
    assertThat(add(1, 1), is(2));
    assertThat(add(2, 2), is(4));
}
Just be seeing this test every developer should cringe. No edge cases tested, no bad cases tested. This is not how you would write a test. But even the good case is not properly tested. Let’s switch to randomized testing here:
public void testAdd() {
    final int a = randomIntBetween(0, Integer.MAX_VALUE);
    final int b = randomIntBetween(0, Integer.MAX_VALUE);
    assertThat(add(a, b), allOf(greaterThanOrEqualTo(a), greaterThanOrEqualTo(b)));
}
We’re still adding two numbers, but we are also adding a different assumption. We would like to be sure that adding two positive integers will return an integer that is bigger than any of the integers passed.
Running this test might return fine, but you still have a hunch that there is an issue. How about running this a thousand times?
@Repeat(iterations = 1000)
public void testAdd() {
    final int a = randomIntBetween(0, Integer.MAX_VALUE);
    final int b = randomIntBetween(0, Integer.MAX_VALUE);
    assertThat(add(a, b), allOf(greaterThanOrEqualTo(a), greaterThanOrEqualTo(b)));
}
This runs the test a thousand times with a different random seed and thus different integers on every run. We also figure out pretty quickly, that our tests fails roughly 50% of the time (turns out that there is a not so carefully hidden integer overflow).
This would be the error message:
java.lang.AssertionError:

Expected: (a value equal to or greater than <1667057423>
           and a value equal to or greater than <1800656534>)
     but: a value equal to or greater than <1667057423>
          <-827253339> was less than <1667057423>

REPRODUCE WITH: ./gradlew ':server:test'
  --tests "de.spinscale.MyTest.testAdd"
  -Dtests.seed=EC29A319F9128F9A
  -Dtests.locale=pl-PL
  -Dtests.timezone=America/St_Kitts
The first part being the failed assertion, however the second part is more
interesting. This part reveals a seed, that can now be used in the test to
reliably reproduce the numbers, that triggered the test to fail:
@Seed("EC29A319F9128F9A")
public void testAdd() {
    final int a = randomIntBetween(0, Integer.MAX_VALUE);
    final int b = randomIntBetween(0, Integer.MAX_VALUE);
    assertThat(add(a, b), allOf(greaterThanOrEqualTo(a), greaterThanOrEqualTo(b)));
}
Running this will make the test fail all the time and you can now start working on
fixing the test, then removing the @Seed annotation again to ensure this
test keeps running randomized when merged.
As you may have already noticed when walking up the class hierarchy, there
were some more annotations, allowing for more features in the ESTestCase
class.
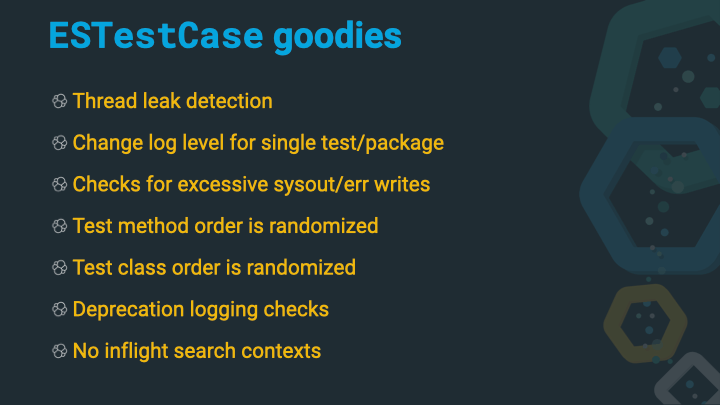
- Thread leak detection: The thread leak detection is a great feature, which is also part of randomized testing. If you start a thread within any code executed during a test, and then you don’t shut it down again properly, then the test suite will fail. Threads should be handled with care and this is a nice helper.
- Changing Log Levels: You can change log levels on a per-test case using
the
@TestLoggingannotation
@TestLogging(reason = "testing logging",
             value = "org.elasticsearch.transport.TcpTransport:DEBUG")
- Check for sysout/syserr writes: If you want to make sure, your application does not clutter system out/err, then this is a good way to check
- Randomization: Test method order: The order of each test method is randomized within a test class
- Randomization: Test class order: The order of test suite classes are randomized
- Deprecation logger checks: Elasticsearch has the ability to log into a deprecation log, if a deprecated feature is used. By default, a test fails, if the deprecation log has been populated during test, unless you explicitly specify the expected deprecation in your test.
- No in-flight search contexts: Another Elasticsearch check, that ensure that all searches are closed properly and no in-flight searches are happening after a test
In addition, there are some more helpers, that everyone usually has in their own code base. Elasticsearch uses hamcrest for checking assertions in the ElasticsearchAssertions class. There are a few specialized assertions classed like for geo as well. This class features methods like:
assertNoSearchHits(searchResponse);
assertHitCount(searchResponse, 10);
assertExists(getResponse);
assertFirstHit(searchResponse, hasId("my_id"));
There are a couple dozen assertion methods in that class, which may also be
useful, if you write your own tests against Elasticsearch. In addition there are
also a couple of custom matchers, that can found in the
ElasticsearchMatchers
class.
You may also want to check out the whole org.elasticsearch.test
package
Next up: Integration Testing. For integration tests to work, we need to start an Elasticsearch instance. This could be done via java code, however you do not want to start more than one node within the same JVM - as this never happens in production either. In order to avoid this, Elasticsearch is started via gradle, the network ports are exposed and so testing can happen.
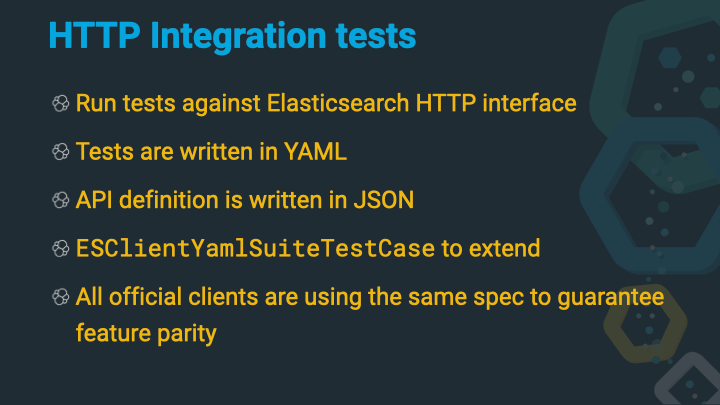
Let’s first take a look at are the HTTP integration tests, you will also find them referred to as YAML tests in Elasticsearch sometimes.
A core concept of those tests is to have a specification of the API, which is written in JSON, and a load of tests, which are written in YAML.
Another interesting part of this rest API spec is not the way it is written, but the way it is used outside Elasticsearch. All official Elasticsearch clients are using this spec as a test runner. With this little trick, once can ensure, that all the clients are up-to-date with the Elasticsearch endpoints and that all clients provide the same functionality.
The definition of an API endpoint looks like this
{
  "get":{
    "documentation":{
      "url":"https://www.elastic.co/guide/en/elasticsearch/reference/master/docs-get.html",
      "description":"Returns a document."
    },
    "stability":"stable",
    "url":{
      "paths":[
        {
          "path":"/{index}/_doc/{id}",
          "methods":[
            "GET"
          ],
          "parts":{
            "id":{
              "type":"string",
              "description":"The document ID"
            },
            "index":{
              "type":"string",
              "description":"The name of the index"
            }
          }
        }
      ]
    },
    "params":{
      "preference":{
        "type":"string",
        "description":"Specify the node or shard the operation should be performed on (default: random)"
      }
      ...
    }
  }
}
This is for the Get API. The JSON and YAML files are part of the so-called REST API Spec within the Elasticsearch source. This file in particular is here.
The JSON definition contains the allowed HTTP methods and paths for an operation, lists the required and optional parameters in the URL path as well as for the query parameters. Based on this the clients can build some sort of validation before sending a request and have all the information to contact an Elasticsearch node.
Whenever a new API endpoint gets added in Elasticsearch, such an API specification gets added as well. Next up is a YAML test:
---
"Basic":

  - do:
      index:
        index: test_1
        id:    中文
        body:  { "foo": "Hello: 中文" }

  - do:
      get:
        index: test_1
        id:    中文

  - match: { _index:   test_1 }
  - match: { _id:      中文      }
  - match: { _source:  { foo: "Hello: 中文" } }
Even though YAML is not the most intuitive format for a test, this one here
is still pretty easy to read. Everything prefixed with a do is an action
to be executed. In this case a document gets indexed and after that retrieved.
The next step is to execute a set of assertions which compares the response
from the get action with a few expectations as part of the match YAML tag.
There are more possibilities than just matching the JSON structure
  # existence of fields
  - is_true: nodes
  - is_false: non_existing

  # number based comparison
  - gt:  { indices.test.primaries.segments.count: $num_segments }
  - gte: { number_of_nodes:         1 }
  - lte: { indices.test_index.filter.term.field.boost: 1.0 }

  # length of an array
  - length: { suggest.result: 1  }
You can go more complex here and also assign variables that you are using later
  - do:
      index:
          index:  test_1
          id:     1
          body:   { foo: bar }
  - match:   { _version: 1}
  - set: { _seq_no: seqno }
  - set: { _primary_term: primary_term }

  - do:
      get:
          index:  test_1
          id:     1
  - match: { _seq_no: $seqno }
  - match: { _primary_term: $primary_term }
You can also skip certain tests on certain versions
---
"Noop":
  - skip:
      version:  " - 7.3.99"
      reason:   "Noop does not return seq_no and primary_term until 7.4"
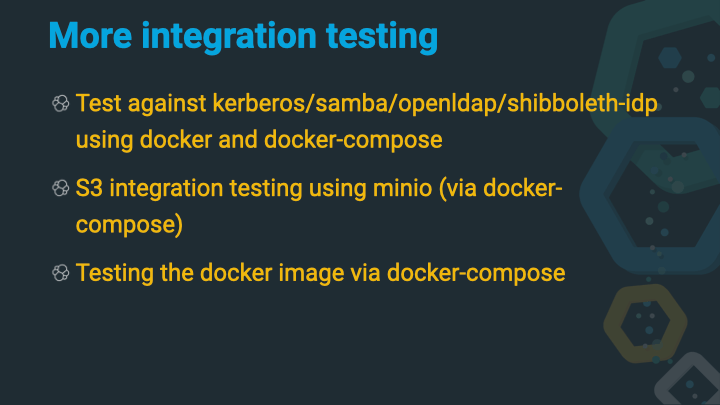
While the HTTP tests are just a very obvious way of integration testing, there are integrations with other software like Kerberos, openldap, shibboleth or minio. Docker is used for those.
You can check out a couple of more example in the test/fixtures directory
of the Elasticsearch source, see
here,
which also includes fixtures for google cloud and azure storage.
Next up are the tests of all the build artifacts, like the zip archive or the Debian/redhat packages.
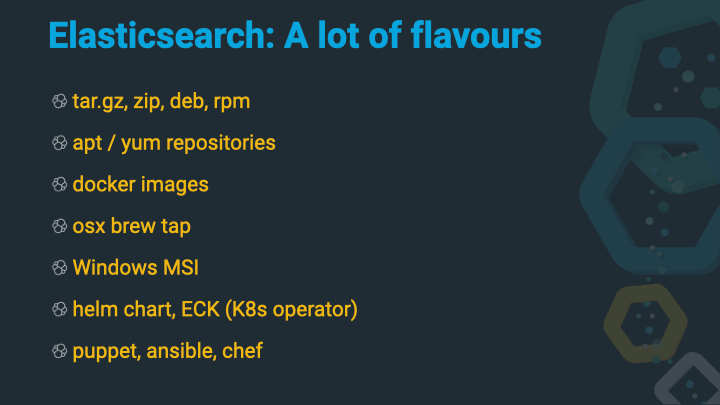
Elasticsearch comes in a lot of shapes. On top of the zip/rpm/deb/tar.gz
distributions, there is also a Debian and yum repository to download the
latest release. A docker image is also part of the build. You can check the
distribution/packages folder for an incomplete overview of the different
package flavors, see the distribution/packages
directory.
Special flavors like the ansible, puppet or chef packages are in their own respective repositories and tested there. The same applies to the Elastic Cloud on Kubernetes.
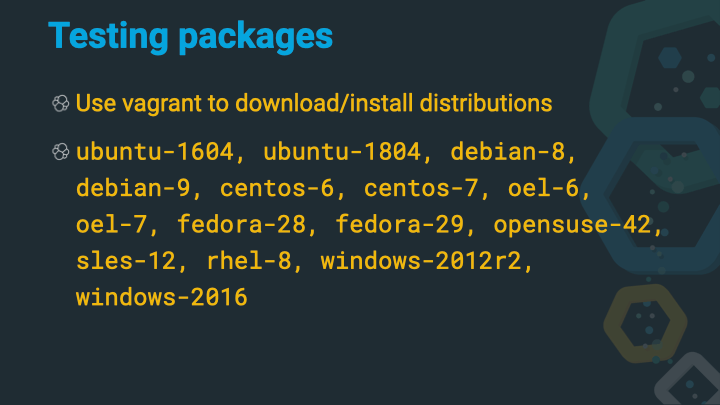
Right now, vagrant is used for package testing. You can see the Vagrantfile in the root directory of the Elasticsearch repository. This file contains more than a dozen different operating systems that need to be supported. Nowadays the support got a little bit easier, as most Linux distributions tend to use systemd to start and stop services. In earlier versions a single debian or redhat package however needed to support systemd and sysvinit in a single package for different distributions in order to prevent building a package for each distribution.
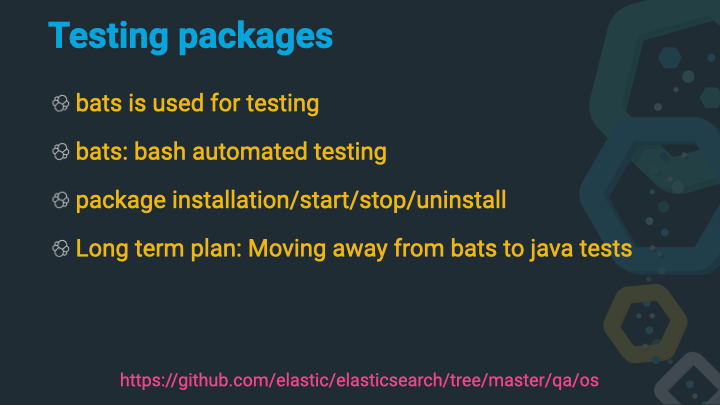
The testing itself is done using bats. Bats is the Bash-Automated-Testing-System and TAP compliant framework for bash. However, development ceased to continue, even though there seems to be a more feature rich fork available.
A bats test looks like this
@test "[$GROUP] install a sample plugin from a directory with a space" {
    rm -rf "/tmp/plugins with space"
    mkdir -p "/tmp/plugins with space"
    local zip=$(ls $BATS_PLUGINS/custom-settings-*.zip)
    local zipname=$(basename $zip)
    cp $zip "/tmp/plugins with space"

    install_plugin_example "/tmp/plugins with space/$zipname"
    remove_plugin_example
}
The test fails in case of unsuccessful exit code (everything but 0).
There are a bunch of different tests like installing, uninstalling a plugin, upgrading Elasticsearch, stopping, starting in order to make sure that all the basic commands are working as expected with all the distributions.
The long term plan however is to move away from bats and write such tests in Java as well.
And now on to the favorite topic of any software developer: Backwards compatibility. As with any software, you have to remain backwards compatible, so your users can upgrade over time and also properly prepare upgrades - which means figure out what needs to be changed before the upgrade happens.
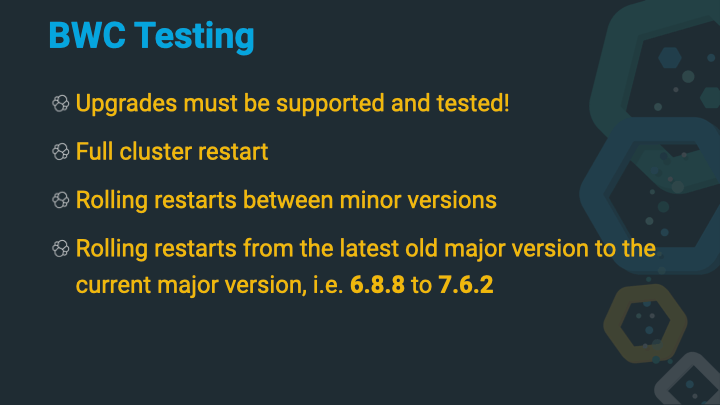
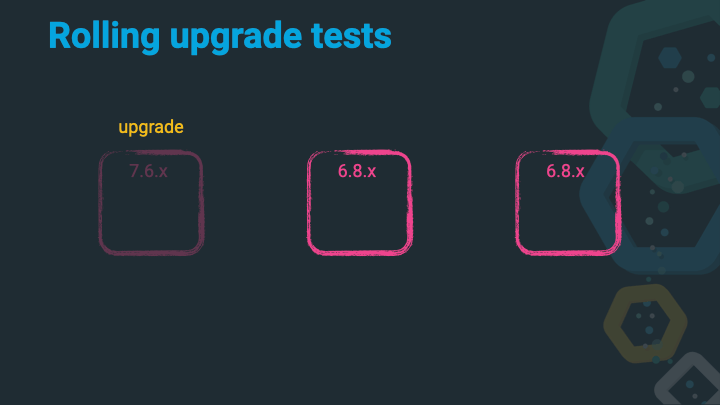
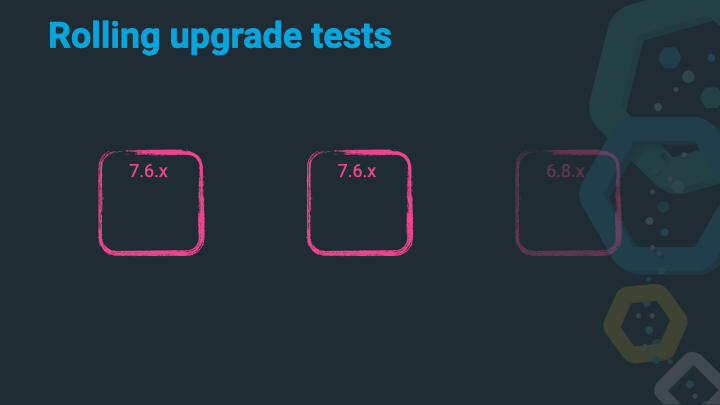
Elasticsearch has two major upgrade modes. You can either do a full cluster restart by shutting down all nodes at the same time, upgrading them and then starting them again or do a so-called rolling restart, where each node gets shutdown, upgraded and restarted before the next node is handled the same way. The latter solution requires Elasticsearch to talk to different versions and still be able to form a cluster and service requests.
Rolling restarts are supported from the latest old major release to the current major release. So in order to upgrade from Elasticsearch 6 to 7, you should first upgrade to the latest 6.x release (6.8.8 at the time of this writing) to the latest 7.x release (7.6.2 at the time of this writing). Upgrading within the same major version should generally work without problems.
Let’s take a look in more detail how this works, and then look how this is executed in more detail - again it’s just an integration test, right?
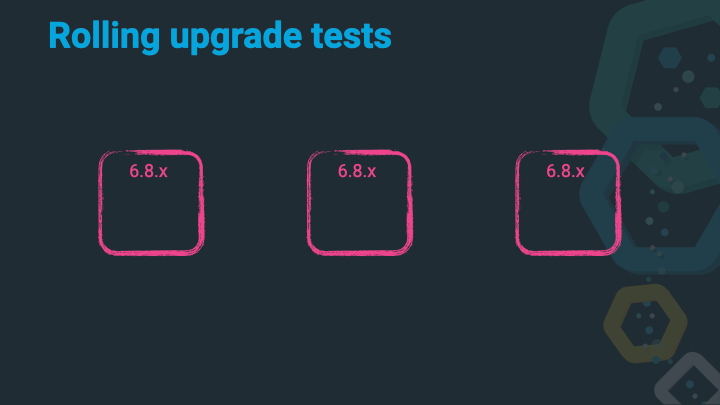
Let’s assume we have a happy three node cluster running on the latest 6.8.x release. We’ve been checking the deprecation log and read the breaking changes docs and even trusted the Upgrade Assistant. All of these steps are explained in more detail in the Upgrading the Elastic Stack documentation.
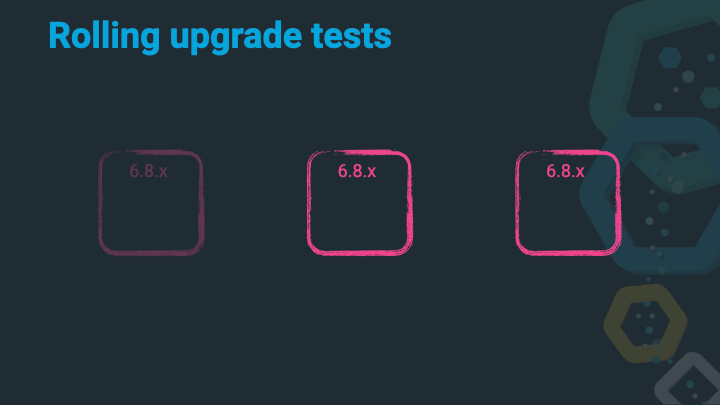
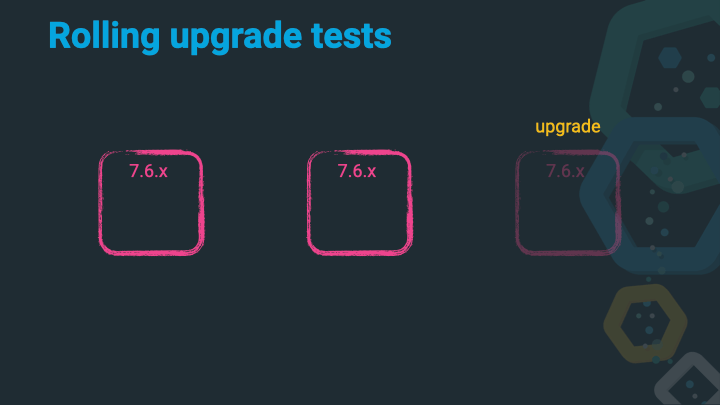
Shut down the first 6.x node.
Upgrade that 6.x node to 7.x.
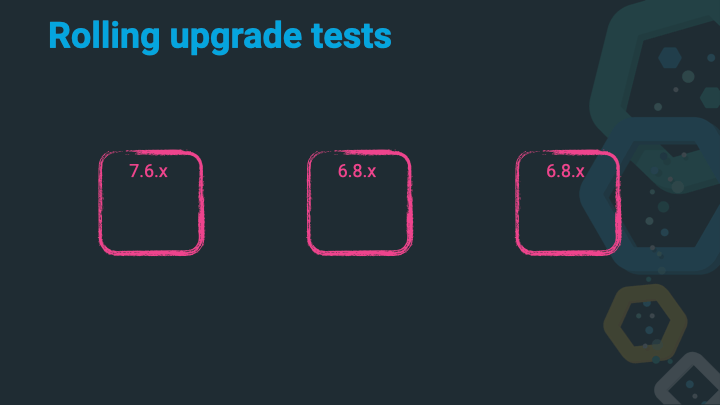
Start up that 7.x node, wait to join the cluster, wait for allocations and a green cluster state.
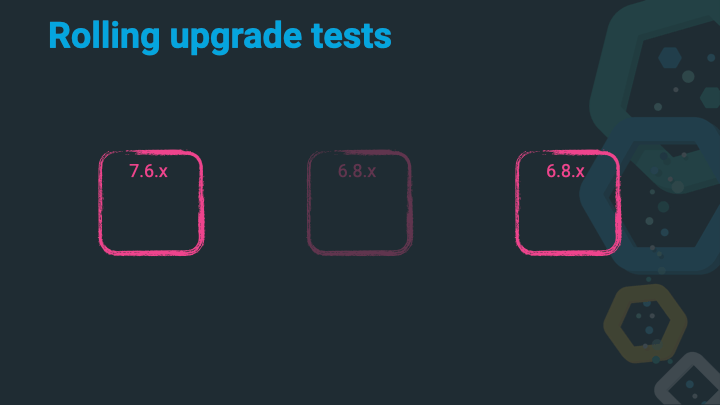
Shut down the second 6.x node.
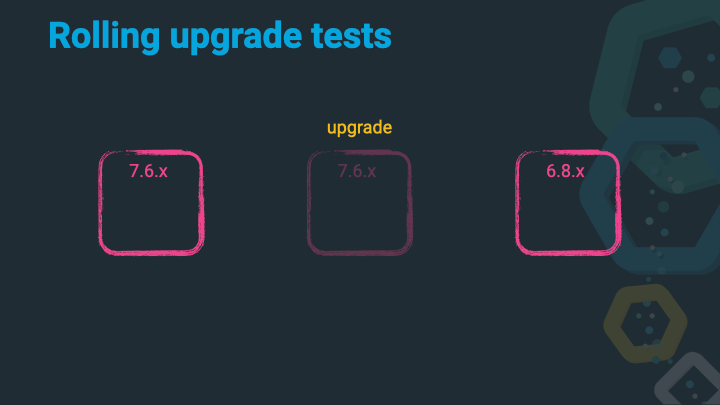
Upgrade that 6.x node to 7.x.

Start up that 7.x node, wait to join the cluster, wait for allocations and a green cluster state.
Shut down the second 6.x node.
Upgrade that 6.x node to 7.x.
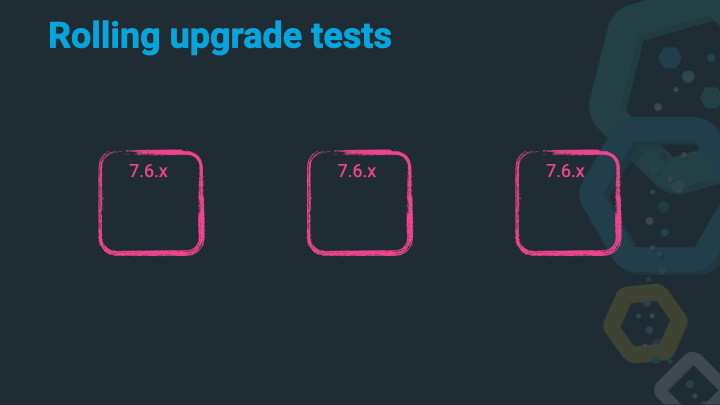
Start up that 7.x node, wait to join the cluster, wait for allocations and a green cluster state. You are done, without any downtime to your application!
Of course this ignores all the work required to get to the first stage, working on all the deprecations, possibly fixing your applications and how they index or query data, but once the deprecation log is empty, and the migration assistant says you are good to go, the upgrade itself will be rather operational.
Just another reminder to checkout the Rolling Upgrades Elasticsearch documentation at this point.
Soooo, who of you is making sure their documentation is always in sync with the product and run with every CI build, so that wrong or outdated documentation will fail the build? I hope everybody :-)
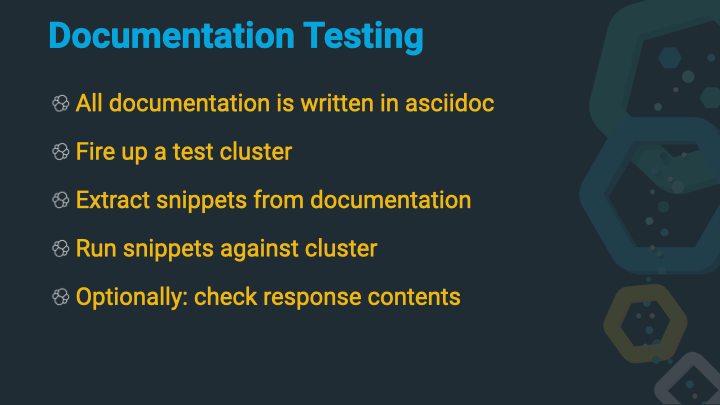
Let’s talk a little bit about writing documentation. First, all the docs (of all the products) are written in asciidoc. Consider it a more powerful markdown, that is also fairly customizable.
Next, each documentation is part of each repository. So there is no friction when creating a PR and also adding the documentation in the same step (which also makes it easier to review).
You can check out the docs/ folder in the source if you want to understand the structure of our documentation.
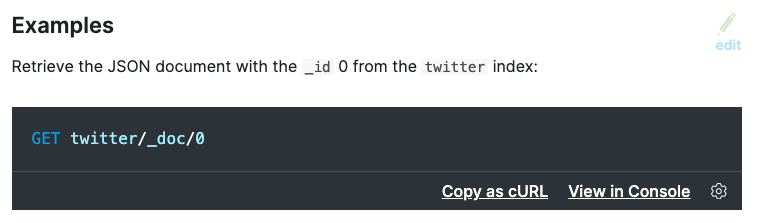
Let’s take a closer look at the code snippets in the docs. They look like this
[source,console]
--------------------------------------------------
GET twitter/_doc/0
--------------------------------------------------
// TEST[setup:twitter]
The console part in the code block header marks this to be displayed in a
special way, so that you can copy this snippet as a cURL request into your
buffer or open the whole snippet directly in Kibana. See this image:
One of the nicest features of the documentation is the ability to create a
PR right from the docs by clicking the Edit button. So in case of typos
it’s super fast to fix.
But back the above example. The syntax within the code block is exactly the
same as used in the Kibana Console. One more specialty is the
comment after the code block. That allows you to add some more information.
In this case the code block requires the twitter setup to be run before it
is executed. The twitter setup can found in the docs/build.gradle file. Five documents get indexed into the index named twitter.
Now, when the snippet is run, the twitter index is created first, then the snippet is executed and if the HTTP response code is in the 2xx series, the test is supposed to be a success. You can go even further and even check the response!
[source,console-result]
--------------------------------------------------
{
    "_index" : "twitter",
    "_id" : "0",
    "_version" : 1,
    "_seq_no" : 10,
    "_primary_term" : 1,
    "found": true,
    "_source" : {
        "user" : "kimchy",
        "date" : "2009-11-15T14:12:12",
        "likes": 0,
        "message" : "trying out Elasticsearch"
    }
}
--------------------------------------------------
// TESTRESPONSE[s/"_seq_no" : \d+/"_seq_no" : $body._seq_no/ s/"_primary_term" : 1/"_primary_term" : $body._primary_term/]
This code snippet is marked as console-result and therefore is compared
with the last response that has been received. It’s basically a JSON
comparison, but with a twist due to the TESTRESPONSE comment below the
snippet. This one replaces the _version and _seq_no fields from the JSON
snippet with the real value from the response before comparing the JSON.
This way a test can deal with fields that are dynamic in a response, but not
in the documentation snippet.
Another neat trick is to replace a part of the request URL to only return a certain part of the response
[source,console]
--------------------------------------------------
GET /_search
{
    "aggs" : {
        "genres" : {
            "rare_terms" : {
                "field" : "genre"
            }
        }
    }
}
--------------------------------------------------
// TEST[s/_search/_search\?filter_path=aggregations/]
As you can see, here is a // TEST comment, not a // TESTRESPONSE
comment. This replaces the _search part of the request and appends a
filter_path variable, ensuring that only the aggregations are returned.
The response snippet replaces the three dots with nothing, as only the
aggregation data is returned due to the filter_path.
[source,console-result]
--------------------------------------------------
{
    ...
    "aggregations" : {
        "genres" : {
            "buckets" : [
                {
                    "key" : "swing",
                    "doc_count" : 1
                }
            ]
        }
    }
}
--------------------------------------------------
// TESTRESPONSE[s/\.\.\.//]
Elasticsearch uses gradle. A. lot. of. Gradle. In the early days it used gradle in 2010, then it was switched to mvn in 2011 and back to gradle again in 2015.
If you’re interested in seeing all the different gradle work, check out the buildSrc/ directory of the Elasticsearch source. At the time of this writing there are 18 custom gradle plugins in that directory, adding support for running tests with docker, vagrant, downloading distributions and JDKs, starting up Elasticsearch instances for REST tests and much more. On top there is also a fair share of gradle tasks being added like (precommit) tasks to check for proper usage of loggers (no missing arguments) or checking for duplicate jars on the classpath or for the usage of forbidden APIs, checkstyle and more.
In order to speed up detection of failures in PRs before they get merged (after approval only of course!) and to not have to wait on developer notebooks for all tests to pass, every pull request by an organization member gets automatically run on CI as well.
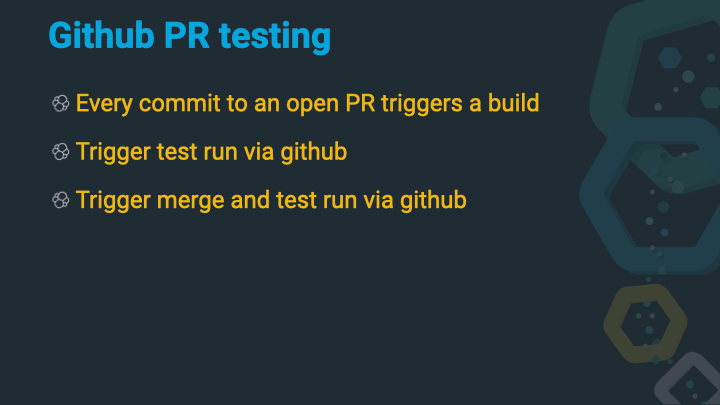
Tests can also be rerun via PR comments and master can also be merged in (if automatically possible) via a comment. This way it’s easy to ensure a PR is up to date before merging.
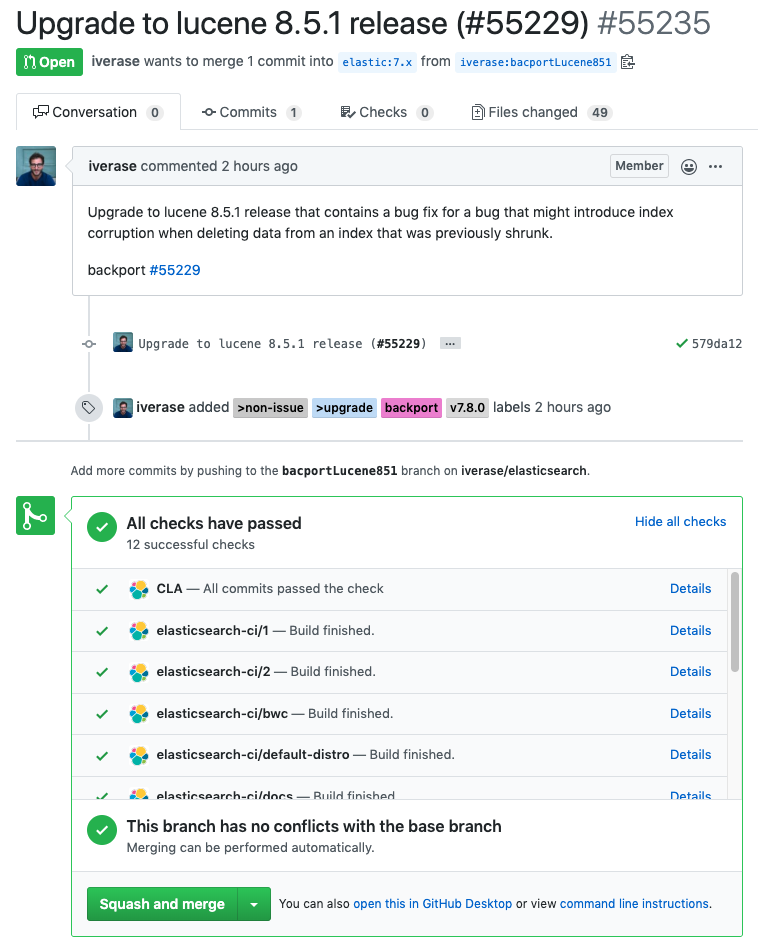
You can see there a list of checks that should be green for a PR to be merged. A single test run is split into several runs in order to parallelize the test run to speed it up.
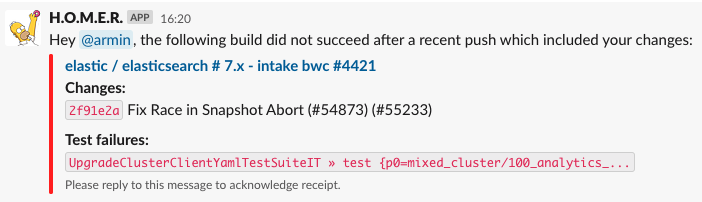
There is also a slack bot that pings the last committer in case of a build failure after a PR has been merged.
So, let’s take a look at CI, shall we?
You can go to Elasticearch CI and scroll down the sheer number of jenkins jobs. But what is probably longer is the sheer number of builds running right now. There are dedicated jobs for the currently active Elasticsearch branches (five right now), and each of those branches has 15 jenkins jobs configured, the master branch even more. On top of that there are more jobs for the Hadoop integration, Lucene tests, documentation (for a few more different projects) and Machine Learning, totaling in almost 300 jobs - just for Elasticsearch.
Also, a few of those jobs consist of fairly big smaller jobs, like the unix/windows/osx compatibility tests that run against different operating systems and distributions, like this one.
All in all you end up with a massive amounts of builds per day across many different branches, pull requests - which of course are indexed into Elasticsearch for further analysis with Kibana.
Soooo, are you running nightly benchmarks with your software? Turns out we do, and I can tell you I am very happy about that. Why, because of these benchmarks I spotted a performance regression I introduced before the 7.0 release with absolute ease. I was working on supporting nanosecond timestamps in Elasticsearch by replacing joda time with java time in the code base, and also in aggregations. Joda time introduced a couple of neat optimizations in case of time zones, that never change their offsets. UTC being the most well known one. I did not spot that optimization when porting the code over to java time. Turns out the performance graph did:
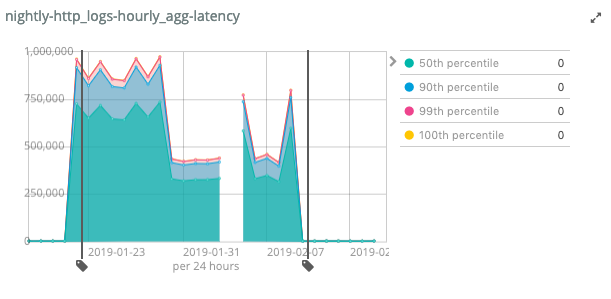
As you can see the latency skyrocketed. The first fix to half it was about creating less objects and thus putting less pressure on the garbage collector, but was still infinitely slower. The final line drop was by re-implementing the joda time behavior by adding an optimized code path for this standard case. You can read more that in the blog post about supporting nanosecond timestamps in Elasticsearch.
Also, if you are interested in our nightly benchmarks, check out benchmarks.elastic.co. This features a list of data-sets, which are used to run tests every night.
The tool that is used to run those tests is open source as well and called rally. You can also use rally with our own custom data if you want and come up with reliable numbers for your own data-sets.

So, our tests are the greenest ever, our benchmarks outperforms all of our previous versions, so all we have to do is a quick release. Well… releasing is tough, especially when you are not a web application that can be silently upgraded in the background, but you have to provide versioned downloads, as it is the case for the Elastic Stack.
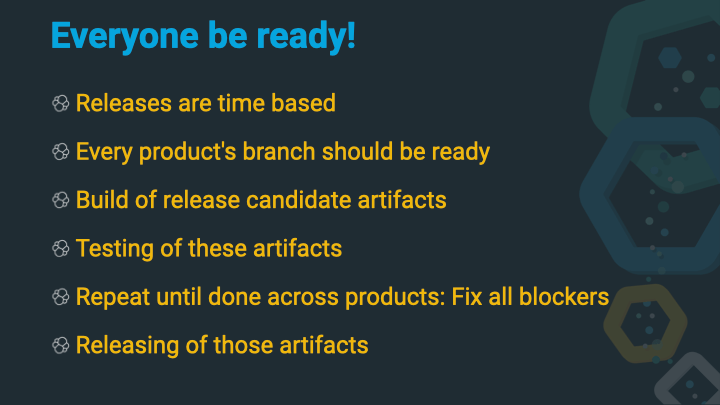
So, releases are time based, there is a new major every couple of weeks or months. This implies that every product that is part of the release has a branch, a release can be created from (or a branch that needs to be cut somewhat earlier).
The next steps is to build a set of release artifacts. Those get tested, and if issues are found, it’s marked as a blocker. The fix is applied, new artifacts get build and the whole process repeats until all blockers are fixed and tests are good. Then these artifacts can be released.
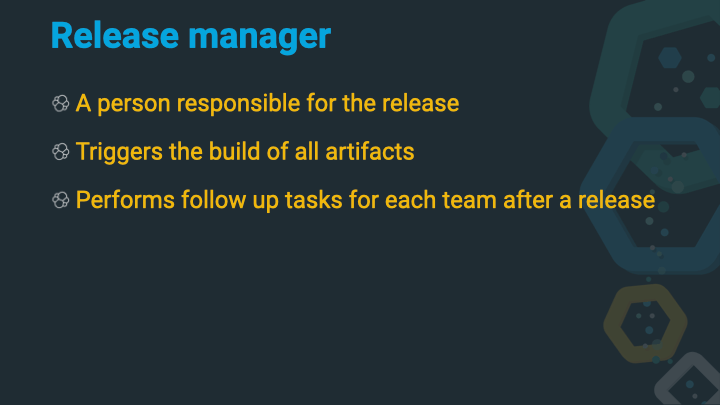
There is a single dedicated release manager per release (release as in a minor version like 7.6.2). This person triggers the build and subsequent rebuilds and also ensure that once a release is public follow up tasks are done.
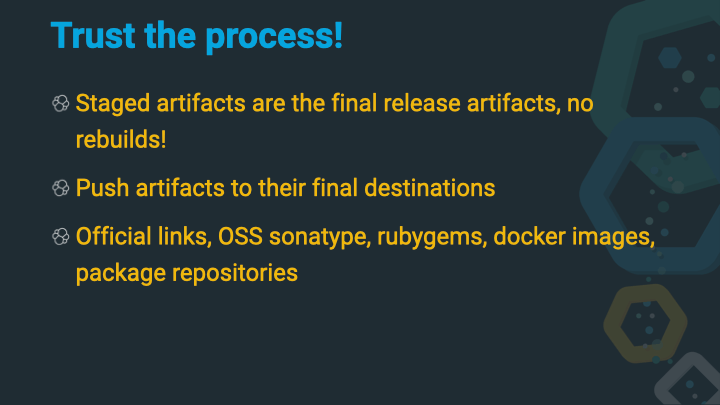
One important note: The artifacts that are created by triggering the release process are the artifacts that will be released. There is no additional build done. This ensures that even an accidental commit to a repository will not affect a release.
This also means that the final process of doing a release is taking the created artifacts and pushing them to their final destinations - and this is where quite a bit of work is needed, as there are a lot of final destinations, think of sonatype, rubygems, docker hub, deb/rpm package repositories.
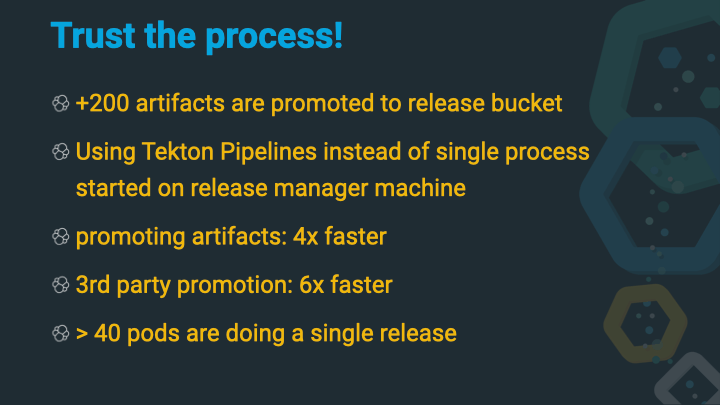
In total there are more than 200 release artifacts to be promoted to completely different locations. Back in the days this was done from the release manager machine and thus dependent of the upstream internet connection. Then this was done via a machine in a data center, which was already much faster, but the final solution to this was the use of tekton pipelines in Kubernetes to push artifacts in parallel. Right now more than 40 pods participate in the release process.
But this is not it. There is much more work to do after pushing the artifacts.
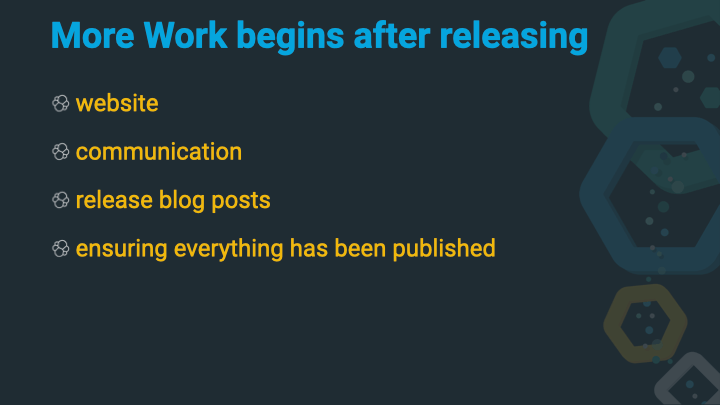
Now the news machine needs to kick in. Documentation needs to be updated or re-linked, the website might need to be updated, release blog posts need to be published, newsletter may need to be sent, so there is a fair share of work, that also requires preparation before a release - that also is frequently undervalued by many engineers - remember it’s not just code.

And we’re not done here. Releasing software is only half of the work. You should not forget to phase out your older releases.
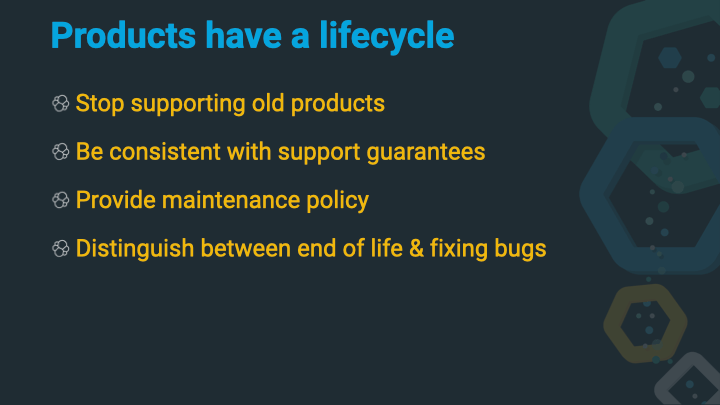
Products have a life cycle. No developer wants to maintain the code written 5 years ago. You are responsible for phasing your software out meaning you do not support anymore. There is a difference between not supporting software and still providing patches for older software that is in its last month of support - you will need to be crystal clear of this, as there are some gotchas. However you need to come up with a very straight plan and write it down so other can understand the implications.
Elastic has list of end of life dates for all products and a small set of rules, how this date came to be. You should do the same if you provide these kind of products as well, as it will clear up a lot of confusion.
On top of that there is also the support matrix which is equally crucial, listing the supported platforms for each of the products in order to make sure you are also phasing out support for operating systems or distributions that are no longer supported or updated by the upstream providers.

We almost made it… just a quick summary, and you can get another coffee!
- Automate early, automate often: everyone keeps saying this, no one is doing it, until it hurts. It’s very hard to figure out the optimal point in time when you decide to automate a tedious process, but once you have a single point of failure (especially when someone is having holidays) or when human errors add up that can be prevented by automation.
- Automate your tests, all of them: we all know, this is not gonna happen, and there is always room for manual and exploratory testing, but if you provide guides how to upgrade in your documentation, make sure you take this documentation and make an automated test out of it.
- Manual testing will still find bugs: Never be worried about that, especially when you have several products that need to work together, those integration points are very good candidates for manual testing, before automating this.
- Automate your releases: I know this is only possible to a certain degree, but this has so many advantages. First, you have the ability to release important fixes outside of your release cadence, because you know it is fast and easy to release. Second, there is no panic of stepping up to be a release manager, if triggering a candidate is easy. Still, documenting the release process properly makes a ton of sense, as you do not want to codify this knowledge in the process that is maintained by a single person.
- Less technical aspects are harder to automate: All the follow up work like release blog posts (and also the proper preparation), post release work, press releases, website updates are harder to automate and usual require more involvement. Don’t forget about those and the fact this also requires preparation, so last minute releases should be prevented.
Resources
Code
- Lucene Test Framework API
- Randomized Testing
- Rally, an Elasticsearch Benchmarking Tool
- Elastic Cloud on Kubernetes
- bats
- bats fork with newer features
- tekton, a Kubernetes native CI/CD
Blog posts & Articles
- Elasticsearch CI
- Kibana CI
- Logstash CI
- Beats CI
- Nightly Elasticsearch Benchmarks
- The journey to support nanosecond timestamp in Elasticsearch
Final remarks
If you made it down here, wooow! Thanks for sticking with me. You can follow or ping me on twitter, github or reach me via Email.
If there is anything to correct, drop me a note and I am happy to do so!
Same applies for questions. If you have question, go ahead and ask!