 Alexander Reelsen
Using Filebeat To Ingest DigitalOcean App Platform Logs
TLDR; This blog post will give a quick introduction into ingesting logs from the DigitalOcean App Platform into Elasticsearch using a Filebeat.
What is DigitalOcean App Platform
One of my biggest pet peeves is ranting about the complexity of k8s. And don’t get me wrong, for some companies this might be a great idea. However for many users the art of deployment is just terrible. Writing YAML, hoping to indent it correctly, configuring ingress rules, rules for rolling upgrades, certificate management - I don’t want to care for any of these, when I want to deploy my code. Even if you don’t maintain and upgrade your k8s cluster yourself, you are still responsible for every single app configuration.
Luckily a couple of companies have figured out that this complexity is just not warranted when all you want to do is to run a few small applications. Qovery has a compelling offer for teams and a super simple configuration by abstracting away the complexity using a deployment engine within your cloud provider - allowing you to use all the cloud provider offerings as well.
As part of trying to resharpen my skill sets for running a modern web application I had the requirement of having a database and a small container for a java application. I don’t want to do any other infra configuration. In June 2020 DigitalOcean introduced pretty much exactly that with the DigitalOcean App Platform, this pretty much being a PaaS, allowing to deploy static apps as well as scale applications and also configure databases or S3 compatible storage.
Also, rollout is basically just a git push. You link your GitHub repository to your app and a new rollout is triggered on every commit. In my case of a java application, a new docker container is created on the DigitalOcean side, so I do not have to care for any infrastructure resources.
Also, a postgres database is part of my application as well as a custom domain.
I do run a postgres database for 15$ per month and a 1GB/1vCPU container for $12 per month. So a little more than 30$ including tax - considering that money my personal gym costs 😃
I won’t dive too deep into setting up your app platform, as I want to focus on getting my application logs into the Elastic Stack, so I assume you have your application up and running.
Configure doctl
So, in order to check if logs are received correctly, let’s quick set up the
doctl CLI tool to check for logs. You can check out the documentation over
here.
Hint: you may want to omit the context, if that is your only DigitalOcean
account. The following should list your DigitalOcean apps.
doctl apps list
Using the ID you can now get the deployments that were triggered based on
commits or configuration changes
doctl apps list-deployments 4a045345-4d94-4566-adgf-aad54365468b
Now, let’s retrieve some application logs of your running application
doctl apps logs 4a045345-4d94-4566-adgf-aad54365468b --type run -f
You can now trigger a HTTP request and should see it in real time. There are also some more HTTP requests, because the DigitalOcean infrastructure checks if your app is alive.
Use the API instead of doctl
After verifying that your application is emitting logs, let’s try to use the
API instead of the doctl CLI tool.
You can check the docs for the API V2 right here. First let’s try to retrieve our app:
curl -X GET -H "Content-Type: application/json" \
  -H "Authorization: Bearer $YOUR_DO_TOKEN" \
  "https://api.digitalocean.com/v2/apps/4a045345-4d94-4566-adgf-aad54365468b"
Now, onto the logs. You need to extract the .app.active_deployment.id path
from the above JSON to retrieve the current deployment ID.
curl -X GET -H "Content-Type: application/json" \
  -H "Authorization: Bearer $YOUR_DO_TOKEN" \
  "https://api.digitalocean.com/v2/apps/4a045345-4d94-4566-adgf-aad54365468b/deployments/$YOUR_DEPLOYMENT_ID/logs?follow=true&type=RUN"
The above request returns a JSON that contains a live_url or url to follow the
latest logs. Let’s try that one out via curl
curl "https://proxy-reg1-3b5c0de713f4.ondigitalocean.app/?token=LOOOOOOONG_TOKEN"
When that connection remains open, you should retrieve new logs after a few seconds, when you app generates those.
So, both ways work to retrieve data. However using the API comes with the problem of statefulness. Unfortunately there is no consistent URL to get the latest live logs of any deployment it seems. This means, one would need to constantly pull the API endpoint for the latest deployment and adapt the URL that gets polled for.
For the sake of this example, let’s stick with the doctl tool and use
Filebeat to read from standard input.
Configure Filebeat
I will not cover Filebeat installation as this is covered well in the official documentation. I also expect you to have an Elasticsearch cluster up and running that you can index into.
So, let’s get up and running with a dead simple Filebeat configuration.
filebeat.inputs:
- type: stdin

output.elasticsearch:
  hosts: ["localhost:9200"]
Reading from stdin, writing to Elasticsearch, and that’s it. Now run the following
while true ; do
  doctl apps logs 4a093887-7d9b-4e6b-acef-aad2963d5c8b --type run -f
done | ./filebeat run -e
The while loop ensures that in case of a redeploy or a connection issue
the doctl is retried immediately. Also you do not have to care about
any deployment ids, as the doctl does the right thing out of the box.
Let’s check if our logs are ingesting.
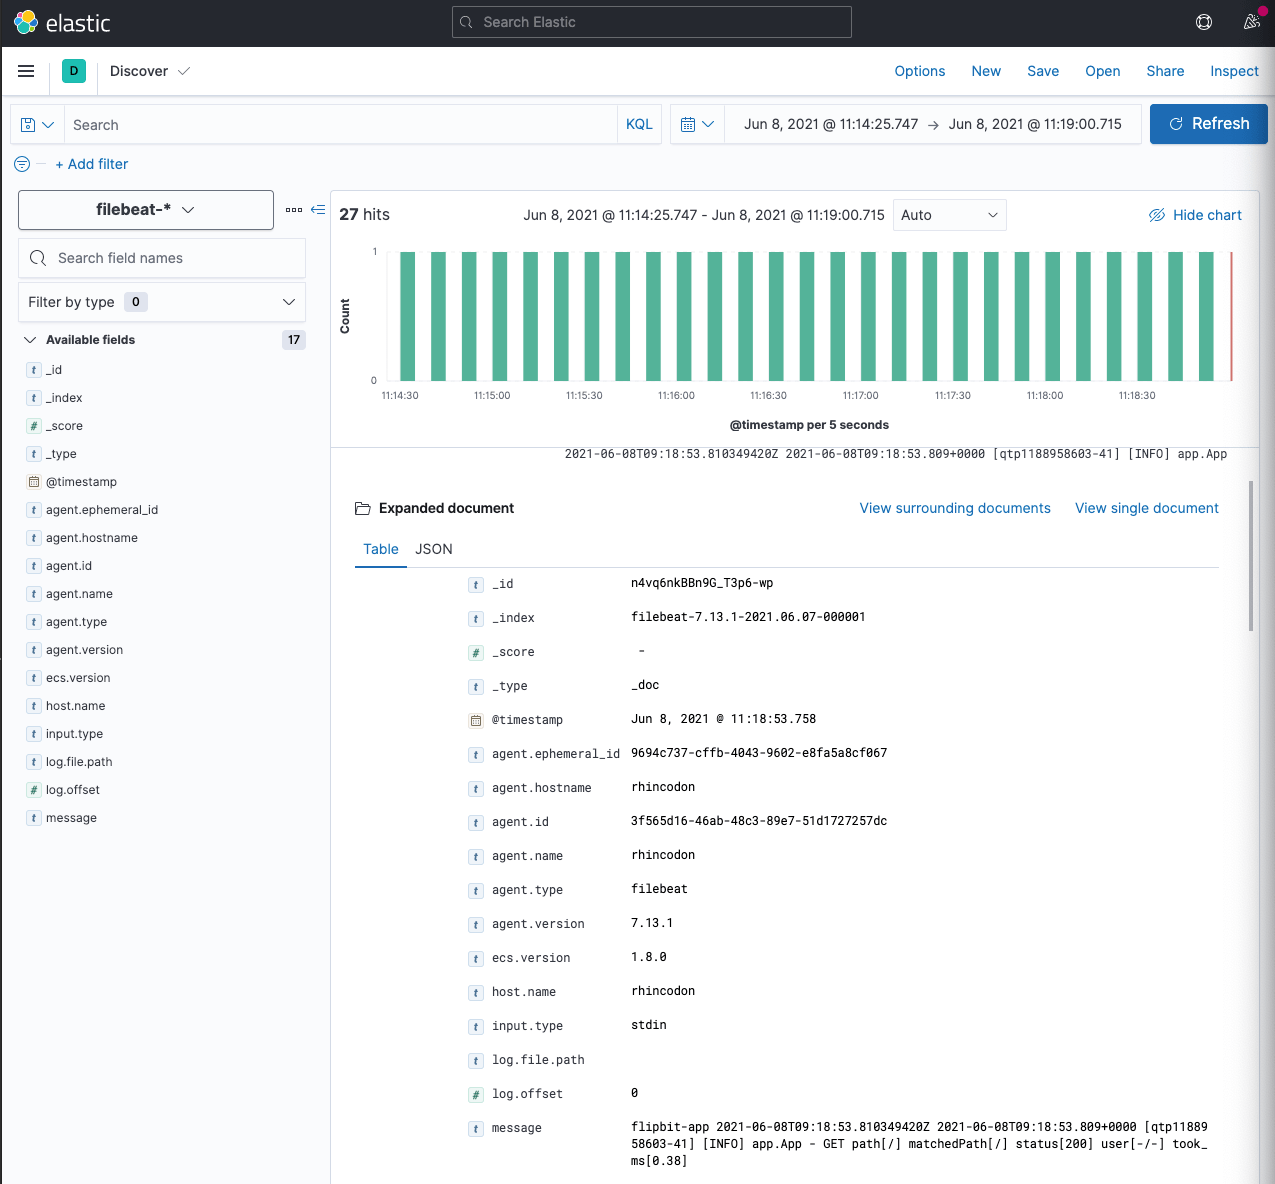
Let the logs ingest
Open Kibana, and go to the Discover app. You should see something like
this.
Creating an ingest pipeline
As seen in the above screenshot, a log message looks like this
do-app 2021-06-08T09:18:53.810349420Z 2021-06-08T09:18:53.809+0000 [qtp1188958603-41] [INFO] app.App - GET path[/] matchedPath[/] status[200] user[-/-] took_ms[0.38]
As a side note: The first field do-app is the name of the app in
DigitalOcean and the second field 2021-06-08T09:18:53.810349420Z is also
from DigitalOcean and does not belong to the application log line.
Let’s create a proper index pipeline on the Elasticsearch side to put the data into single fields
Using the Simulate Ingest Pipeline we can test like this
POST _ingest/pipeline/_simulate
{
  "docs": [
    {
      "_source": {
        "message": "do-app 2021-06-08T09:18:53.810349420Z 2021-06-08T09:18:53.809+0000 [qtp1188958603-41] [INFO] app.App - GET path[/] matchedPath[/] status[200] user[-/-] took_ms[0.38]"
      }
    },
    {
      "_source": {
        "message": "do-app 2021-06-08T09:18:53.810349420Z 2021-06-08T11:38:10.185+0200 [main] [INFO] org.flywaydb.core.internal.database.base.BaseDatabaseType - Database: jdbc:postgresql://localhost:5432/alr (PostgreSQL 13.2)"
      }
    },
    {
      "_source" : {
        "message" : "do-app 2021-06-08T09:18:53.810349420Z    {urlPathPrefix: \"/css\", path: \"build/resources/css\", location: Location.EXTERNAL}"
      }
    }
  ],
  "pipeline": {
    "processors": [
      {
        "dissect": {
          "field": "message",
          "pattern": "%{app.name} %{app.digital_ocean_timestamp->} %{message}"
        }
      },
      {
        "dissect": {
          "field": "message",
          "pattern": "%{@timestamp} [%{app.thread_id}] [%{log.level}] %{app.class_name} - %{message}",
          "ignore_failure": true
        }
      },
      {
        "dissect": {
          "field": "message",
          "pattern": "%{request.verb} path[%{request.path}] matchedPath[%{request.matched_path}] status[%{request.status_code}] user[%{request.auth.user}/%{request.auth.organization}] took_ms[%{request.took_ms}]",
          "ignore_failure": true
        }
      },
      {
        "convert": {
          "field": "request.took_ms",
          "type": "float",
          "ignore_missing": true
        }
      },
      {
        "convert": {
          "field": "request.status_code",
          "type": "integer",
          "ignore_missing": true
        }
      },
      {
        "remove": {
          "field": "request.auth",
          "if": "ctx?.request?.auth?.user == '-' && ctx?.request?.auth?.organization == '-'",
          "ignore_missing": true
        }
      }
    ]
  }
}
Storing the pipeline can be done via
PUT _ingest/pipeline/do-pipeline
{
  "processors": [
    {
      "dissect": {
        "field": "message",
        "pattern": "%{app.name} %{app.digital_ocean_timestamp->} %{message}"
      }
    },
    {
      "dissect": {
        "field": "message",
        "pattern": "%{@timestamp} [%{app.thread_id}] [%{log.level}] %{app.class_name} - %{message}",
        "ignore_failure": true
      }
    },
    {
      "dissect": {
        "field": "message",
        "pattern": "%{request.verb} path[%{request.path}] matchedPath[%{request.matched_path}] status[%{request.status_code}] user[%{request.auth.user}/%{request.auth.organization}] took_ms[%{request.took_ms}]",
        "ignore_failure": true
      }
    },
    {
      "convert": {
        "field": "request.took_ms",
        "type": "float",
        "ignore_missing": true
      }
    },
    {
      "convert": {
        "field": "request.status_code",
        "type": "integer",
        "ignore_missing": true
      }
    },
    {
      "remove": {
        "field": "request.auth",
        "if": "ctx?.request?.auth?.user == '-' && ctx?.request?.auth?.organization == '-'",
        "ignore_missing": true
      }
    }
  ]
}
Finally, let’s fix the Filebeat configuration to add the pipeline.
filebeat.inputs:
- type: stdin

output.elasticsearch:
  hosts: ["localhost:9200"]
  pipeline: "do-pipeline"
Restart the pipeline and see the logs flowing in an improved format in your Discover App.
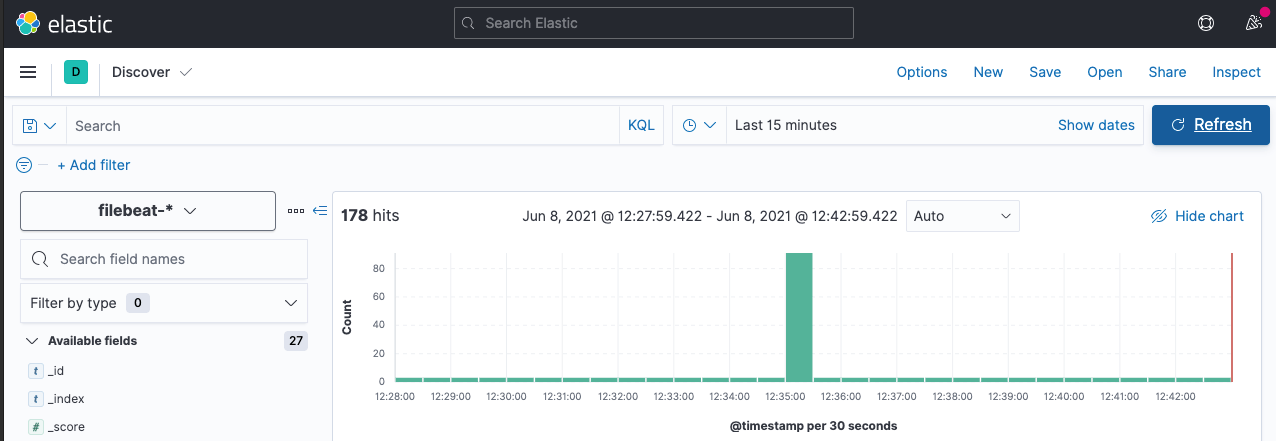
Prevent duplicates
Now we’re parsing the log message my app generates, however, there is still a problem: Restarting the Filebeat resulted in duplicates being indexed, you can see this in the discover app when a huge amount of messages gets indexed:
In order to do this we can utilize the relatively new fingerprint processor and put this as the first processor into our pipeline:
PUT _ingest/pipeline/do-pipeline
{
  "processors": [
    {
      "fingerprint": {
        "fields": [ "message" ],
        "target_field": "_id"
      }
    },
    ...
    other processors here
  ]
}
It’s important to put this as the first processor, as the subsequent
dissect will change the original message field.
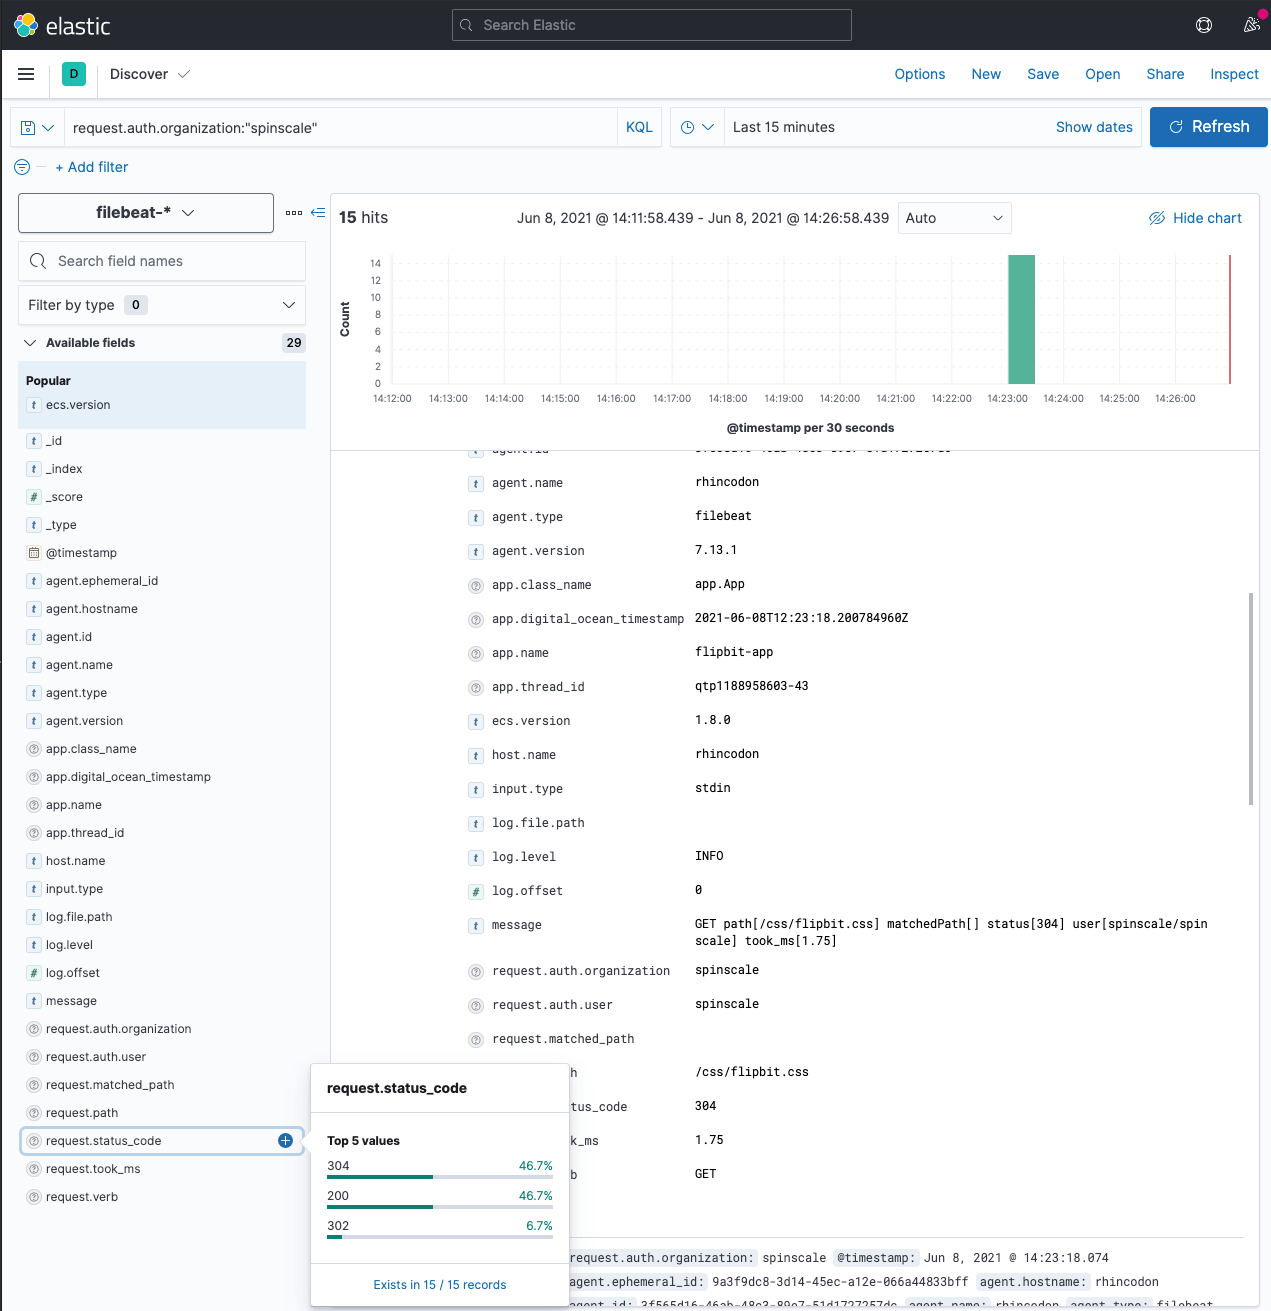
That’s it, no we have carefully dissected our log data and can create all the dashboards we want!
Of course there are a few more caveats.
Caveat: Multi line messages
One more thing that is broken, the way logs are emitted from the doctl CLI
tool are multi line messages. Because of prefixing the multi line message with
the current timestamp and the app name, it’s rather hard to write a proper
regular expression, that can be used for multi line matching in Filebeat.
The best workaround would probably be to use JSON logging instead of text based logging. In my case switching to ecs-logging-java would be a good alternative, as I am running a java application. However there are also alternatives for no less than Go, .NET, Node, Ruby, PHP and Python.
Summary
First: I do not consider logging a solved problem with the DigitalOcean Apps Platform (digital ocean: if you read this, feel free to prove me wrong 😃). The proper workaround for this might be to not log to stdout in your applications, but write directly to a logging provider - which is something I am undecided about as well, but a rather common in the world of containers. The advantage of writing to stdout and gathering this somewhere else would be the decoupling of logging and your application. I have seen my fair share of logger network appenders that stopped the whole application…
That said, a simple mechanism to gather all logs from a deployment and sent them somewhere would be greatly appreciated in the future. The example shown here is not production ready to me, but it could be worked around with another tooling, that polls the digital ocean API and then adapts the endpoint it retrieves data from. However, there has been so much work invented to make deployment easy, that I really do not want to argue with proper logging, so that a logging provider sounds like a good plan.
Another long term solution might be the upcoming OpenTelemetry Logging allowing agents to not only ship metrics and traces, but also the logs to an opentelemetry collector. This however still seems somewhat out.