 Alexander Reelsen
Monitoring Certificate Transparency Logs Using the Elastic Stack
TLDR; This blog post will introduce you into monitoring the certificate transparency log using the Elastic Stack.
What is a certificate transparency log?
The basic idea of certificate transparency is to provide a log of certificates being issued. The log is basically an append only data structure of all the certificates being created by CAs. So, if there is a shady or hacked CA, it would be easy to figure what certificates have been created from that CA and it could be monitored or rejected by the browsers.
There is a bit more to it how it works, so I urge you to take a look at the above link. For us, it is important, that there is component returning all the certificate changes and we will index that one into Elasticsearch.
A websocket certstream
The fine folks at Calidog have created a websocket stream to monitor the certificate transparency log at
wss://certstream.calidog.io/
So, how can we consume this one? Let’s peek at it by using a small
command line tool named websocat.
websocat -1 -E wss://certstream.calidog.io/
This will return a single event that will probably look like this
{
  "data": {
    "cert_index": 1060286926,
    "cert_link": "http://ct.googleapis.com/logs/argon2021/ct/v1/get-entries?start=1060286926&end=1060286926",
    "leaf_cert": {
      "all_domains": [
        "*.xyx518809.direct.quickconnect.to",
        "xyx518809.direct.quickconnect.to"
      ],
      "extensions": {
        "authorityInfoAccess": "CA Issuers - URI:http://r3.i.lencr.org/\nOCSP - URI:http://r3.o.lencr.org\n",
        "authorityKeyIdentifier": "keyid:14:2E:B3:17:B7:58:56:CB:AE:50:09:40:E6:1F:AF:9D:8B:14:C2:C6\n",
        "basicConstraints": "CA:FALSE",
        "certificatePolicies": "Policy: 1.3.6.1.4.1.44947.1.1.1\n  CPS: http://cps.letsencrypt.org",
        "ctlSignedCertificateTimestamp": "BIHyAPAAdgD2XJQv0XcwIhRUGAgwlFaO400TGTO_3wwvIAvMTvFk4wAAAXrDRI4HAAAEAwBHMEUCIQC9QymrHPm45MCamRzBmjCUlN8nFtMqiAuKq5-5krliagIgMUbacUhGtTO2PdoumNf39Zsov1Lyy9YcnbjTEj4Jcl8AdgBc3EOS_uarRUSxXprUVuYQN_vV-kfcoXOUsl7m9scOygAAAXrDRJAPAAAEAwBHMEUCIH5cCCfZPkI4C8hcXlGGVA1NU2fc1DdTBNoK04xY5TqTAiEAlZVy88PxwmZ02rf6ji4oolBa4E4V3qfrTCmpLw4vVjQ=",
        "extendedKeyUsage": "TLS Web server authentication, TLS Web client authentication",
        "keyUsage": "Digital Signature",
        "subjectAltName": "DNS:xyx518809.direct.quickconnect.to, DNS:*.xyx518809.direct.quickconnect.to",
        "subjectKeyIdentifier": "0C:E5:A8:3B:CB:59:E5:52:84:85:27:4A:01:E5:28:D4:40:C5:E2:BF"
      },
      "fingerprint": "C7:E8:5E:67:A3:76:A7:CE:B3:0B:13:2D:6C:3E:07:68:A5:20:09:41",
      "issuer": {
        "C": "US",
        "CN": "R3",
        "L": null,
        "O": "Let's Encrypt",
        "OU": null,
        "ST": null,
        "aggregated": "/C=US/CN=R3/O=Let's Encrypt",
        "emailAddress": null
      },
      "not_after": 1634546085,
      "not_before": 1626770087,
      "serial_number": "4D5A315F896352B8292EABE6A8F3AAF385F",
      "signature_algorithm": "sha256, rsa",
      "subject": {
        "C": null,
        "CN": "xyx518809.direct.quickconnect.to",
        "L": null,
        "O": null,
        "OU": null,
        "ST": null,
        "aggregated": "/CN=xyx518809.direct.quickconnect.to",
        "emailAddress": null
      }
    },
    "seen": 1626773767.778824,
    "source": {
      "name": "Google 'Argon2021' log",
      "url": "ct.googleapis.com/logs/argon2021/"
    },
    "update_type": "X509LogEntry"
  },
  "message_type": "certificate_update"
}
So, everything is wrapped within a data field, except the message_type.
We probably need to unwrap this as part of the ingestions. But let’s figure
out first how to get this stream data into Elasticsearch.
Configuring Filebeat to read the stream
Filebeat has no direct possibility to read from a websocket stream. However
we can pipe the output of websocat to Filebeat and use the stdin input
with a configuration like this.
filebeat.inputs:
  - type: stdin
    json.keys_under_root: true
    json.add_error_key: true

setup.ilm.enabled: false
setup.template.enabled: false

processors:
  # remove all the beat specific fields, just have the meetup data
  - drop_fields:
      fields: [ "log", "agent", "host", "input", "ecs" ]

output.elasticsearch:
  hosts: ["http://localhost:9200"]
  index: "certstream"
Before we can go on, we need to do some setup work on the Elasticsearch side. The certstream has quite a bit of data, so we don’t want to index into a single index, but go with a data stream instead. If you would like to know more about data streams, check out this blog post I wrote a while ago.
Adding an index lifecycle policy
Index lifecycle management helps in aging out older data as well in the case of a hot-warm deployment, where the must queried and indexed data is on your fastest nodes.
PUT _ilm/policy/certstream-policy
{
  "policy": {
    "phases": {
      "hot": {
        "actions": {
          "rollover": {
            "max_primary_shard_size": "5gb",
            "max_docs": 10000000
          }
        }
      },
      "warm": {
        "min_age": "7d",
        "actions": {
          "shrink": { "number_of_shards": 1 },
          "forcemerge": { "max_num_segments": 1 }
        }
      },
      "cold": {
        "min_age": "14d",
        "actions": {
          "freeze" : { }
        }
      },
      "delete": {
        "min_age": "30d",
        "actions": {
          "delete": {}
        }
      }
    }
  }
}
This policy rolls indices over after a certain size or number of documents - this means a new index is created. After a week the index gets shrunk and force-merged to reduce its size, after two weeks it’s frozen to take less resources before it is deleted after a month.
For the sake of simplicity I have not set up a repository to support searchable snapshots - running in production I would highly recommend this though.
Creating an index template
With the above template in place, let’s create an index template
PUT _index_template/certstream-template
{
  "index_patterns": [ "certstream*" ],
  "data_stream": {},
  "template": {
    "mappings": {
      "properties": {
        "@timestamp": {
          "type": "date",
          "format": "date_optional_time"
        }
      }
    },
    "settings": {
      "number_of_shards": 2,
      "index.lifecycle.name": "certstream-policy",
      "index": {
        "sort.field": "@timestamp",
        "sort.order": "desc",
        "default_pipeline" : "certstream"
      }
    }
  }
}
After this you can initialize the data stream
PUT _data_stream/certstream
There is one final step to do, as we referred to a default_pipeline in the
index template, and that is creating such a pipeline.
Manipulating data using an ingest pipeline
As you might remember from the beginning, the JSON data is wrapped inside of
a data field, which I’d like to get removed. While this could be done via
Filebeat as well I chose to create an ingest pipeline named certstream for
this:
PUT _ingest/pipeline/certstream
{
  "processors": [
    {
      "script": {
        "source": """
        if (ctx.containsKey('data')) {
          ctx.putAll(ctx.remove('data'))
        }
        """
      }
    }
  ]
}
Note: That special triple double ticks notation only works in Kibana Dev Tools Console!
Firing up Filebeat
Finally, let’s go ahead and get Filebeat to index some data! Start Filebeat via (considering you are in the Filebeat directory)
websocat -t - autoreconnect:wss://certstream.calidog.io/ \
  | ./filebeat -c filebeat-certstream.yml -e
Now you can check via the console, if data is flowing in
GET certstream/_count
After running this for a few minutes I already ended up with several 10k entries, so this is definitely some sort of higher traffic data set and thus good for demos. You can also take a look at the latest document:
GET certstream/_search
{
  "size": 1,
  "sort": [
    {
      "@timestamp": {
        "order": "asc"
      }
    }
  ]
}
Taking a look at the data, we could do some more adjustments to reduce the index size. There is a good amount of fields, that are unlikely used for full text search:
update_type,cert_link,message_type,source.url,leaf_cert.extensions.*leaf_cert.fingerprint,leaf_cert.serial_number,leaf_cert.issuer.*
Also, there are a few fields that are probably UNIX timestamps like
leaf_cert.not_after, leaf_cert.not_before and seen so you might want
to convert them and make sure they are mapped as date - I did not do this in
this example.
Let’s fix the keyword fields in the index template and do another round of indexing:
PUT _index_template/certstream-template
{
  "index_patterns": [
    "certstream*"
  ],
  "data_stream": {},
  "template": {
    "mappings": {
      "dynamic_templates" : [
        {
          "leaf_cert_extensions" : {
            "path_match":   "leaf_cert.extensions.*",
            "mapping" : {
              "type" : "keyword"
            }
          }
        },
        {
          "leaf_cert_issuer" : {
            "path_match":   "leaf_cert.issuer.*",
            "mapping" : {
              "type" : "keyword"
            }
          }
        }
      ],
      "properties": {
        "@timestamp": {
          "type": "date",
          "format": "date_optional_time"
        },
        "update_type": {
          "type": "keyword"
        },
        "cert_link": {
          "type": "keyword"
        },
        "message_type": {
          "type": "keyword"
        },
        "source": {
          "properties": {
            "url": {
              "type": "keyword"
            }
          }
        },
        "leaf_cert" : {
          "properties" : {
            "fingerprint" : {
              "type": "keyword"
            },
            "serial_number" : {
              "type": "keyword"
            }
          }
        }
      }
    },
    "settings": {
      "number_of_shards": 2,
      "index.lifecycle.name": "certstream-policy",
      "index": {
        "sort.field": "@timestamp",
        "sort.order": "desc",
        "default_pipeline": "certstream"
      }
    }
  }
}
Deleting and re-creating the datastream might be the easiest thing to do here at the expense of losing the already indexed data
DELETE _data_stream/certstream
PUT _data_stream/certstream
After indexing another 100k documents there was a size difference of 10 megabyte, with the smaller index ending at 119 MB. For comparison both indices were force merged down to one segment.
There are more fields you are probably never searching on, so there is even more potential of saving space. What does not look like a lot with a few documents, will change drastically with millions of documents… every bit counts! A good mapping is crucial.
Time to get visual after making sure we get all the data indexed!
Using Kibana Lens to create a dashboard
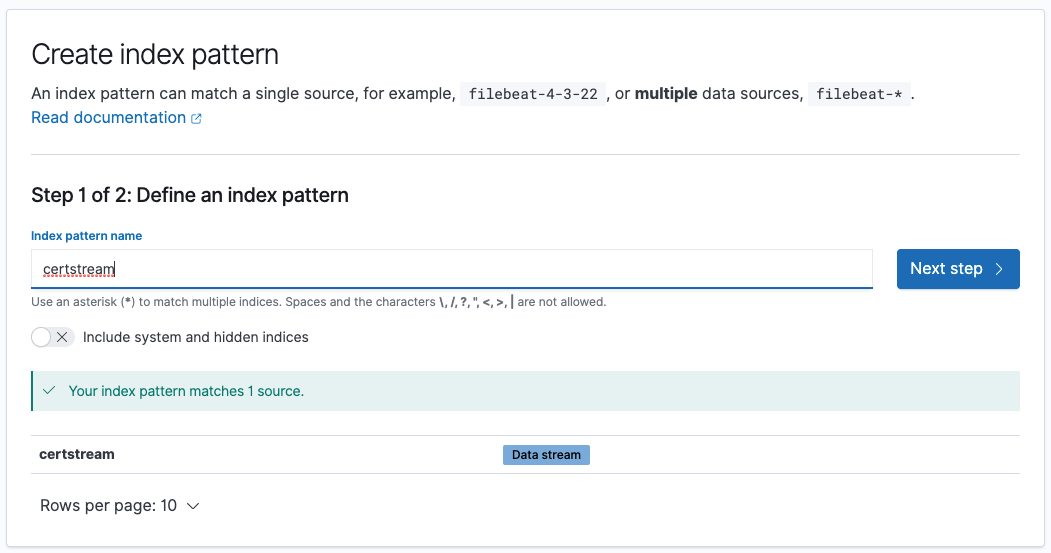
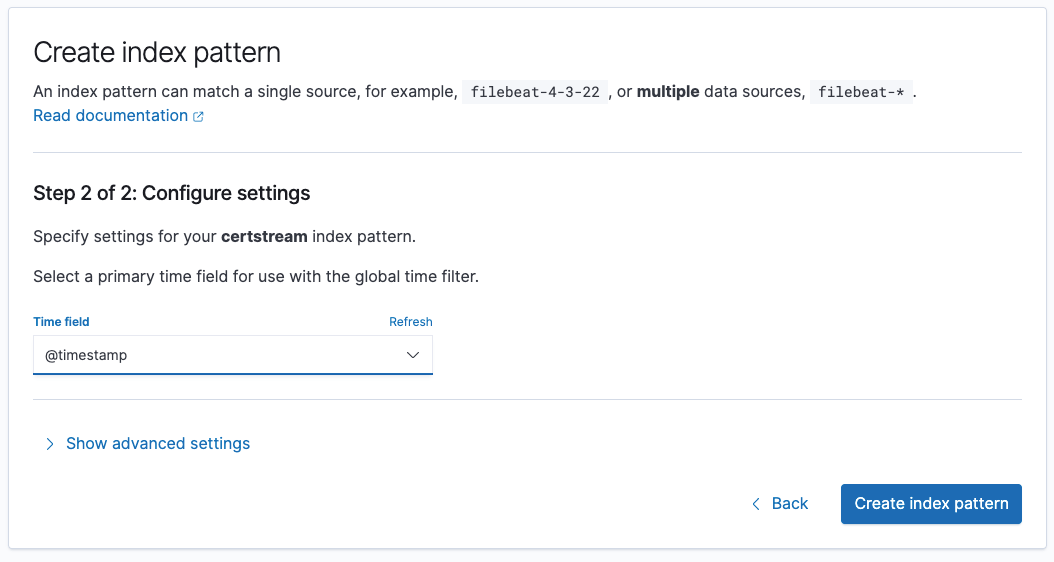
Before creating visualizations, we need to create an index pattern. You can
just specify the certstream data stream and the @timestamp field.
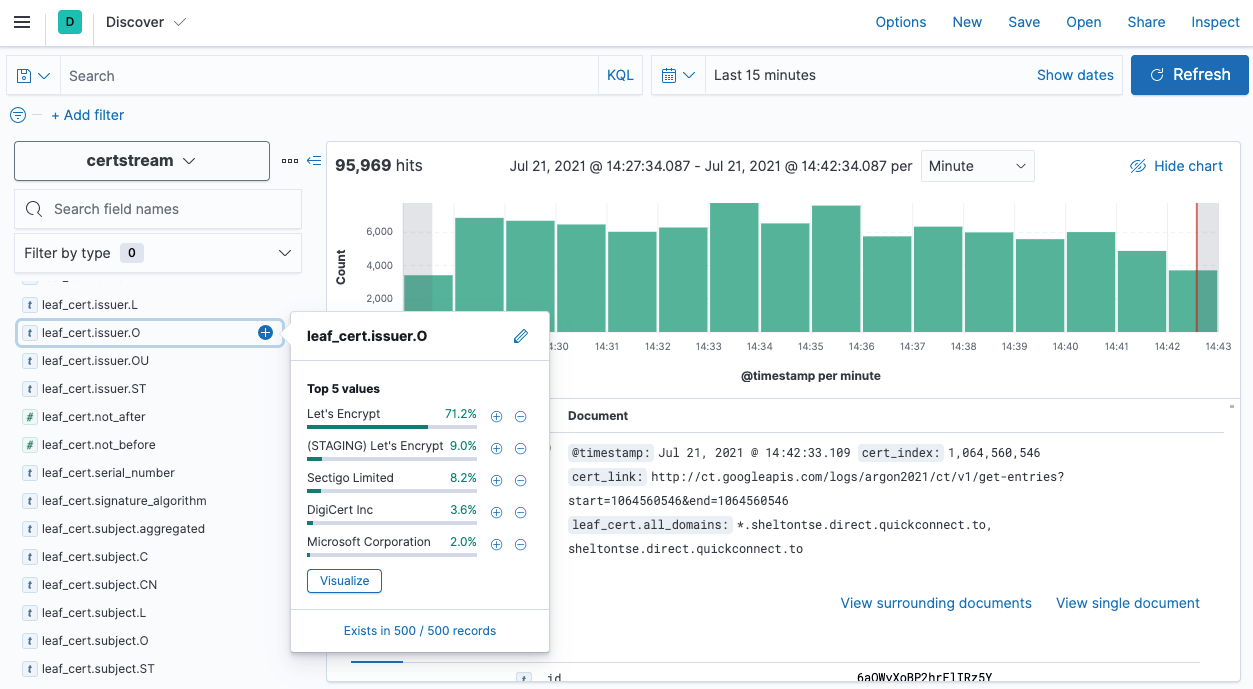
We could go to the Discover tab now and check our data and see it like
this
The next step is to create a new Lens visualization and go from there.
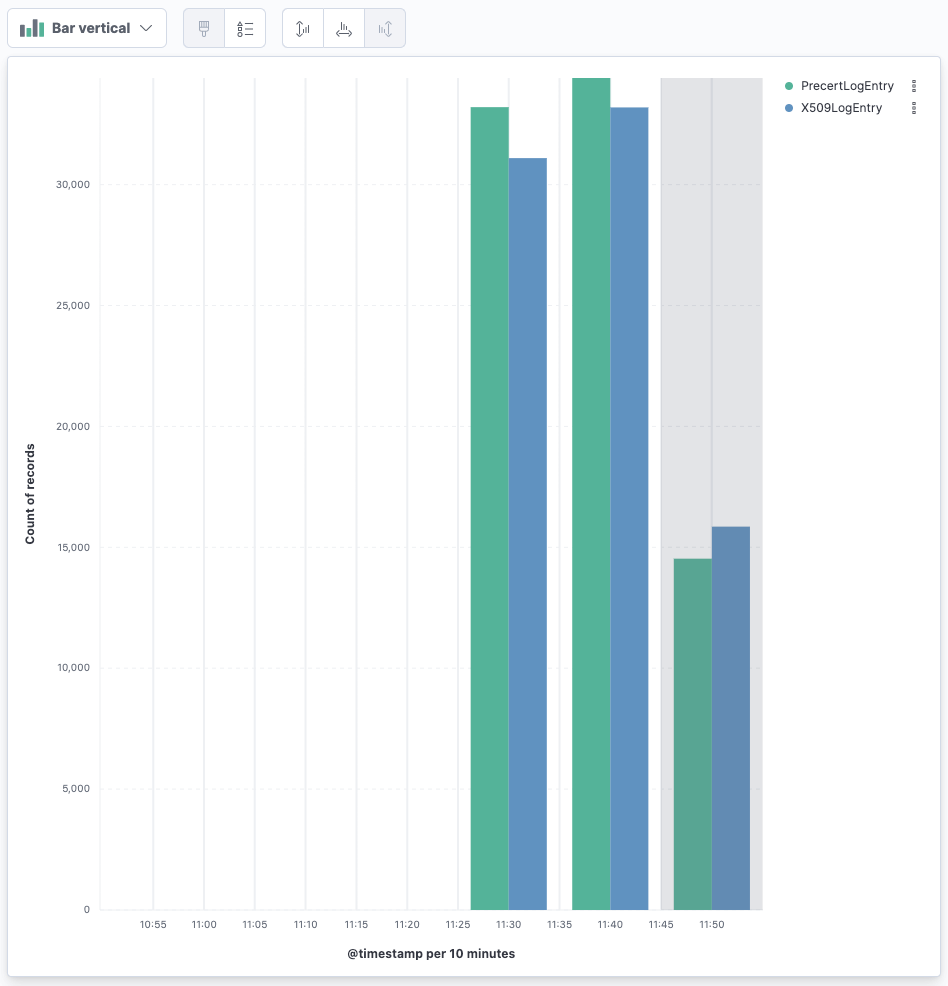
The first visualization is breaking down by time and by the update_type
of each certificate:
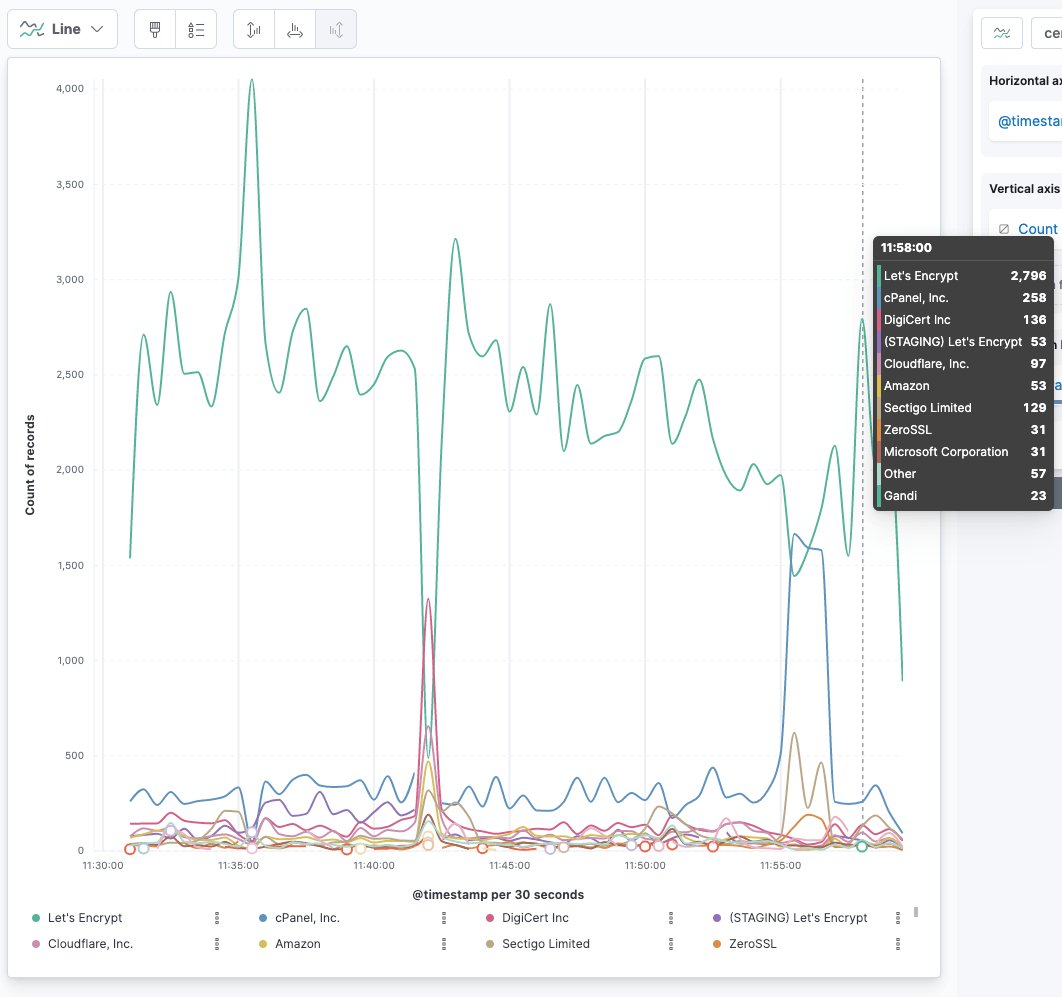
If you have ever wondered just by how much there are more Let’s encrypt
certificates being created, create a line chart with @timestamp on the
horizontal axis and Count of records on the vertical axis. Then break this
down by leaf_cert.issuer.O (for organization) and you will probably see
something like this:
Using Functions in Lens
Since Elastic Stack 7.14 you can use a new feature in Kibana Lens: Functions. Using functions you can add another level of calculations on top of the returned results from Elasticsearch.
Let’s take a look at this visualization:
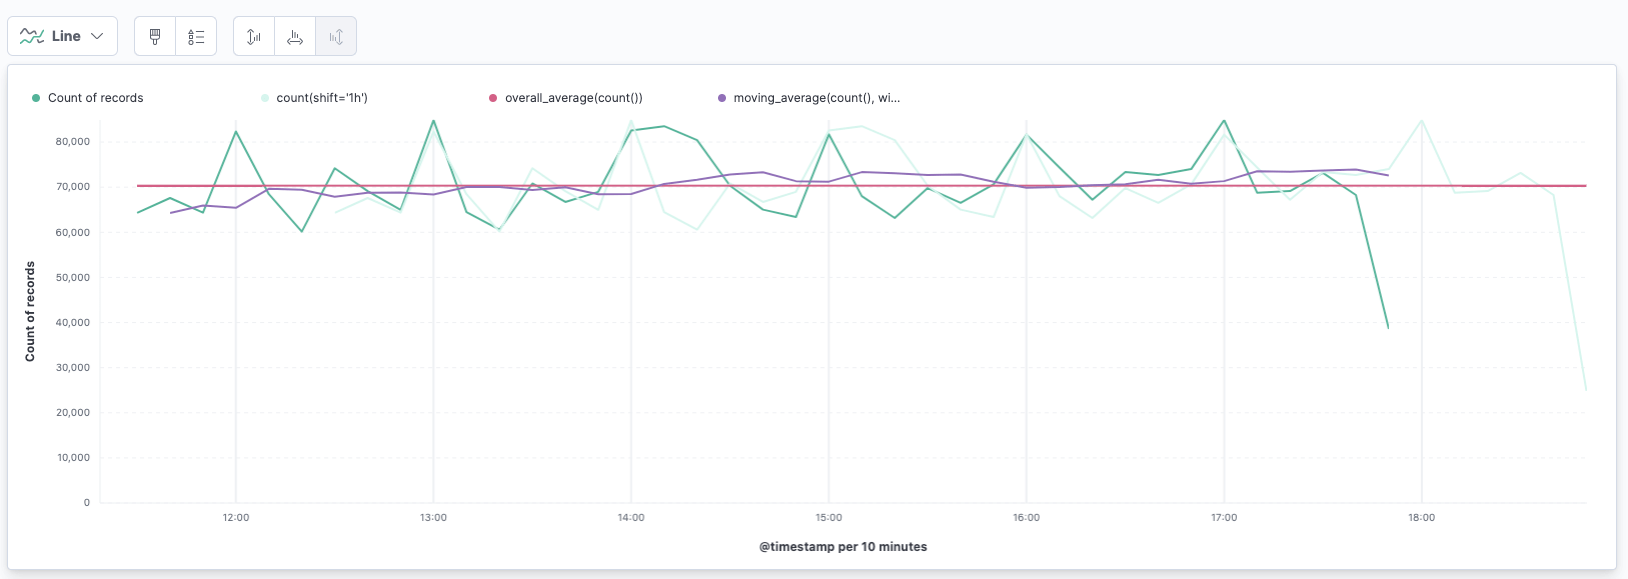
So, this line visualization consists of several graphs. The first one is the count of records per timestamp as usual. This is the green one.
The very light green one is the count of records shifted by one hour. The expression for this is
count(shift='1h')
This takes the count of the same data, shifted by one hour.
The straight red line is the average of this data set
overall_average(count())
Of course this would be highly volatile for outliers, so you could maybe go
with another value like the average of a weighted moving average. The purple
line is actually a moving average with a window of 10 like this
moving_average(count(), window=10)
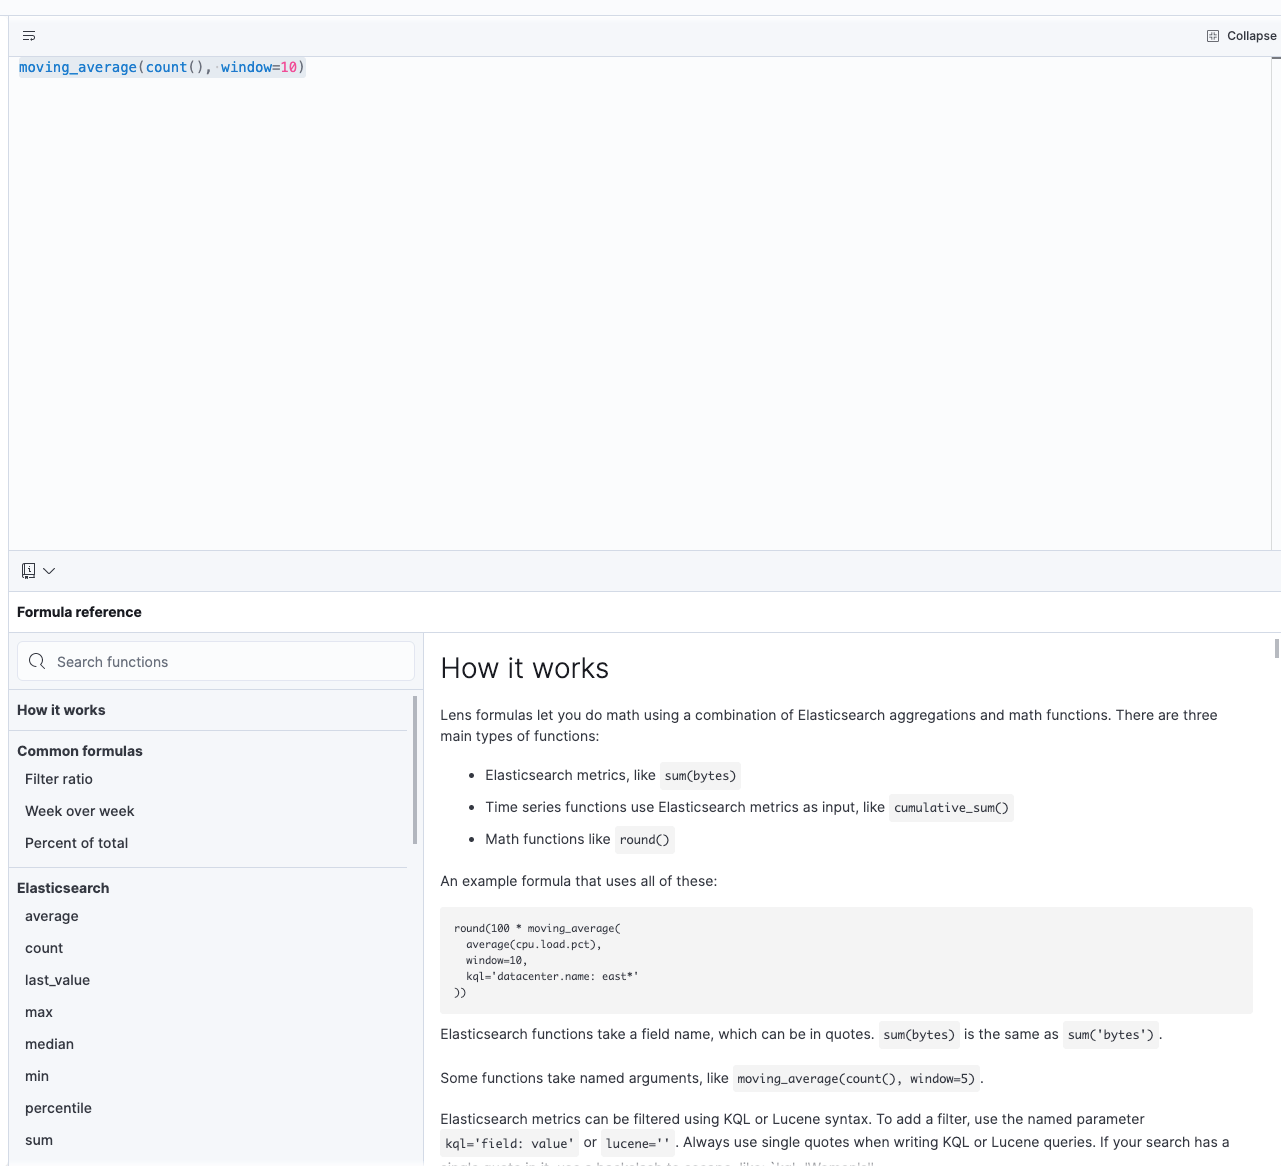
If you click on Expand when entering the Formula tab, you will see some
documentation what functions are available like this:
So, what else can you do with functions. You could sum up two graphs into
one, limiting values to maximum or minimum using the clamp function. Also
the calculation functions are interesting like the differences function in
order to calculate the difference of the previous value.
differences(count())
This looks like this:
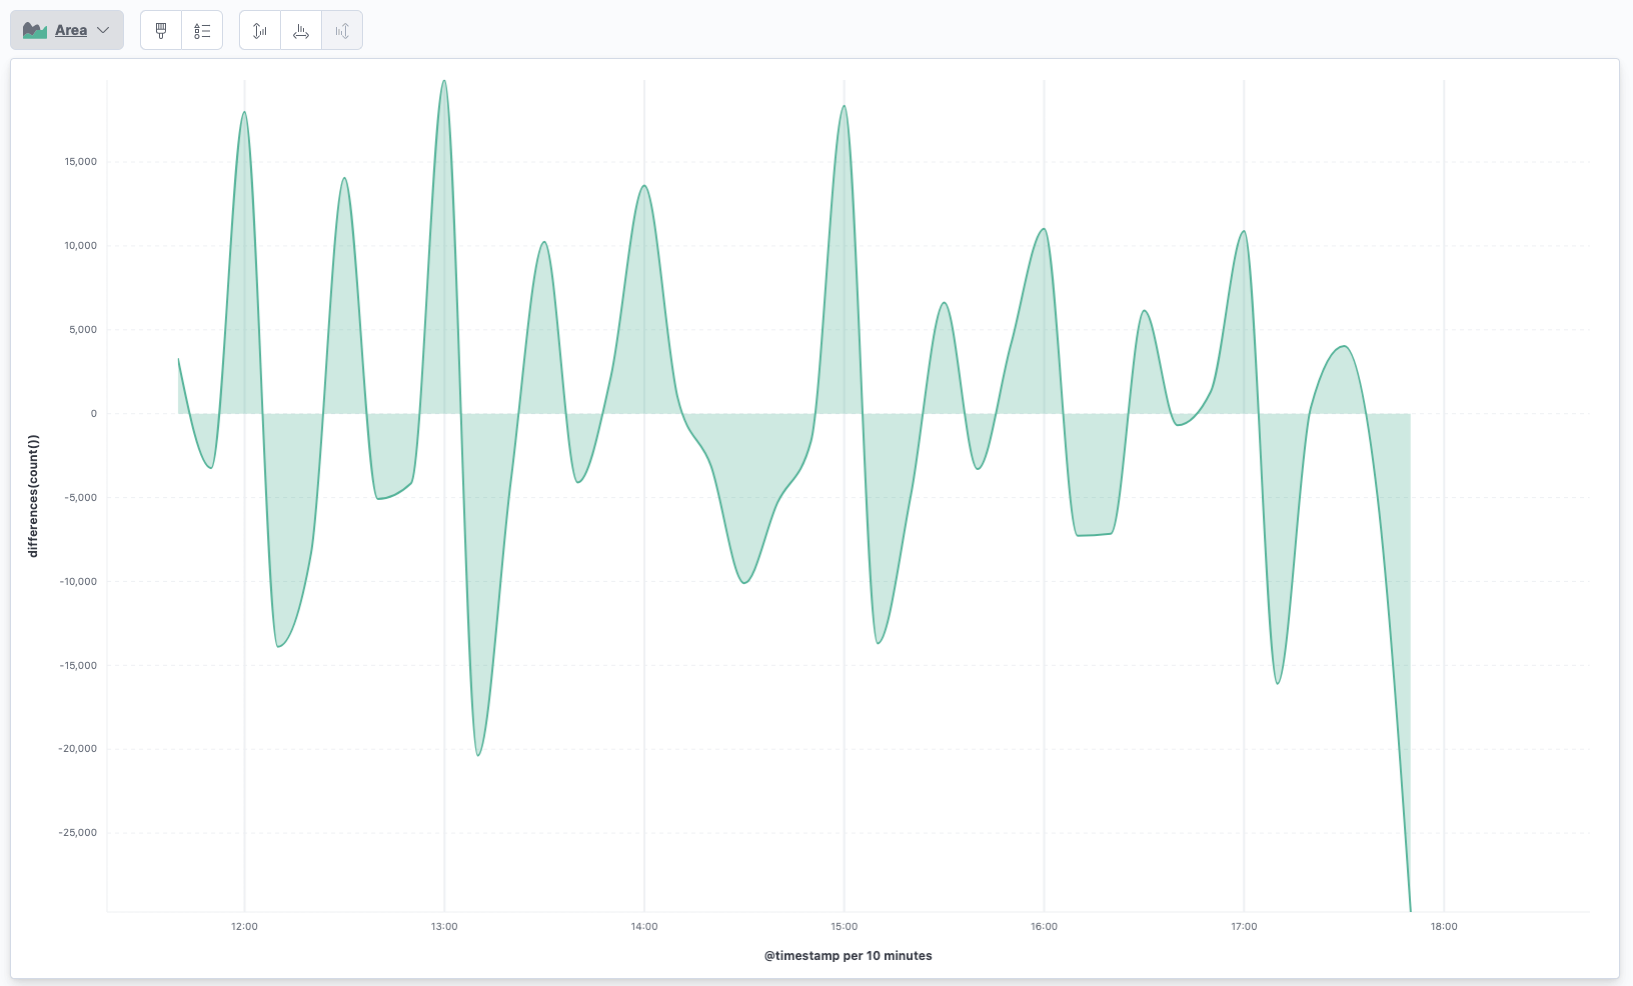
You can see a big increase following by a big decrease at the beginning of each hour. Seems that folks are running cronjobs at each our to create or update certificates. Note that you do not need a formula to do this, you can just select it from the quick functions as well.
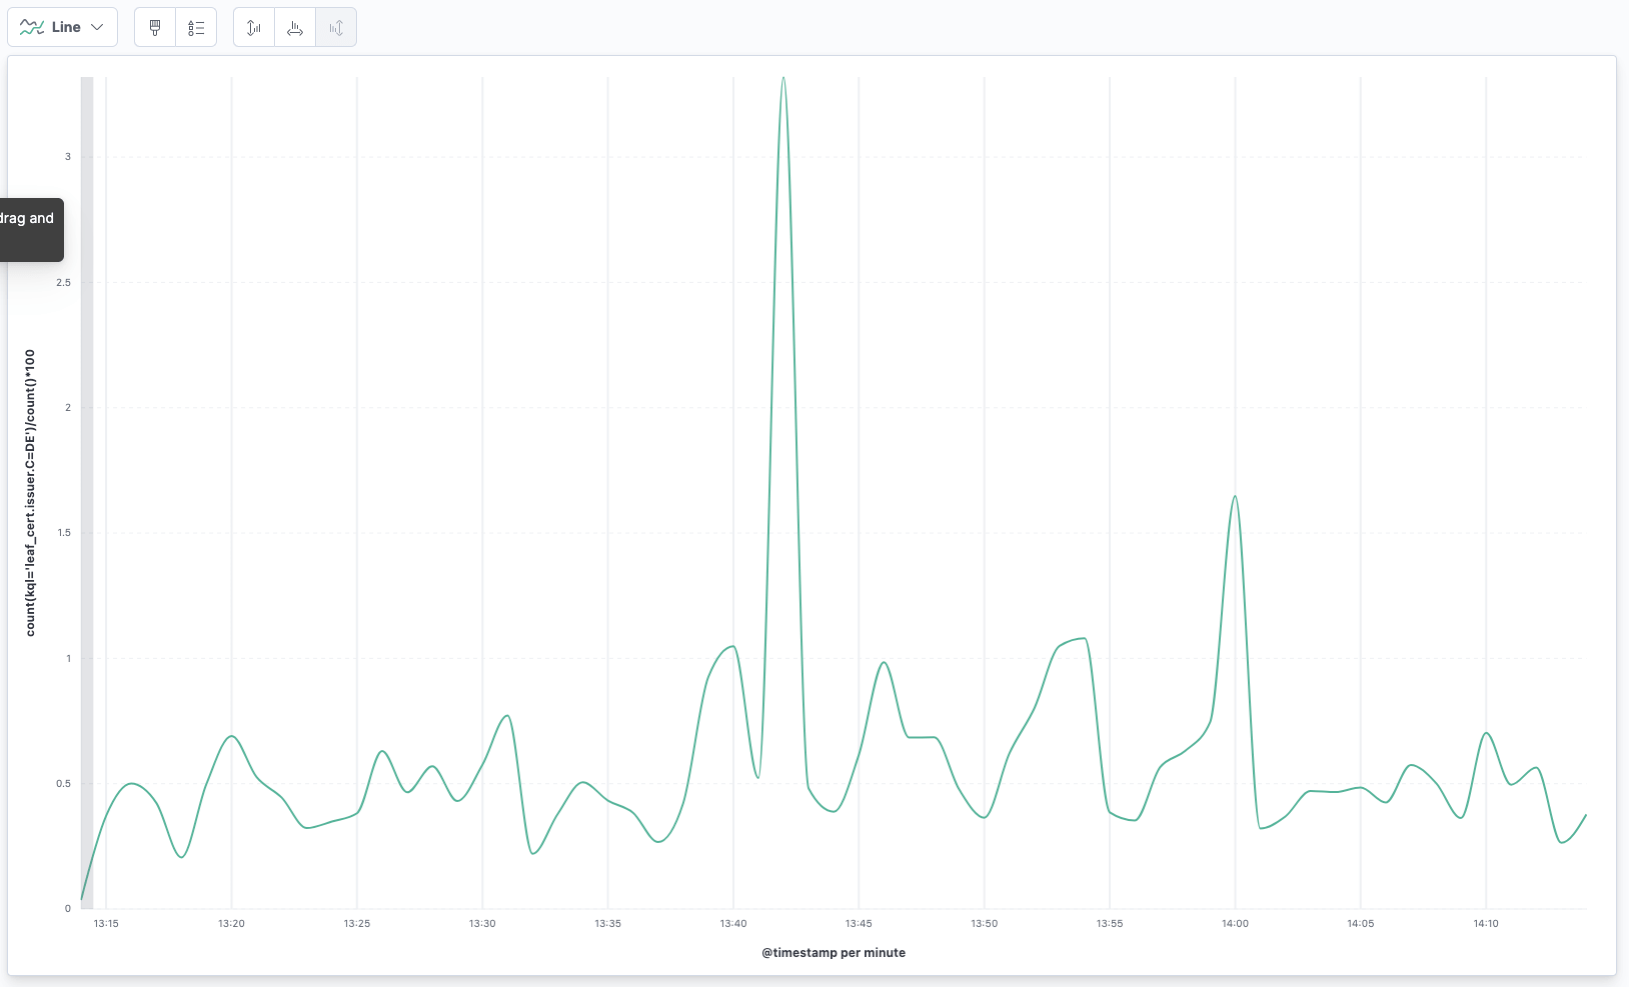
Also, you can do more fancy calculations within the formula, like calculating the percentage of German issuers
count(kql='leaf_cert.issuer.C=DE')/count()*100
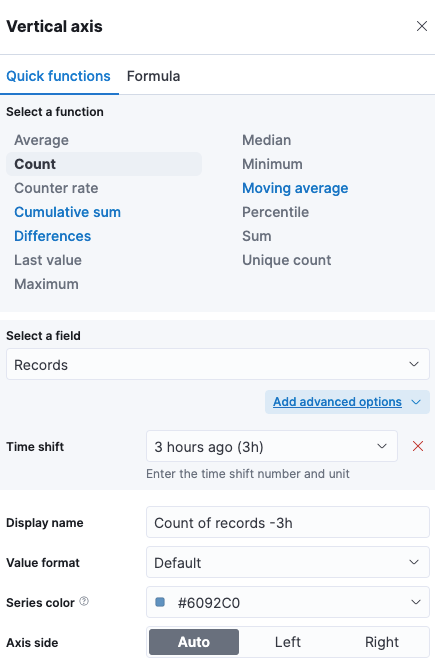
Time shifting without scripting
If you thought you need the Kibana scripting for time shifting, then I have
good news for you. Carefully hidden in the Advanced Options, see
Other use-cases with this data
While the main point of this blog post is to introduce you into Kibana Lens Formulas and Time Shift, we can also take a look at our data from a different angle. You could use the creation of TLS certs to search for services like Elasticsearch:
GET certstream/_search
{
  "size": 0,
  "aggs": {
    "by_domain": {
      "terms": {
        "field": "leaf_cert.all_domains.keyword",
        "include": ".*elasticsearch.*",
        "size": 100
      }
    }
  }
}
The same would work with postgres or redis and might be a nice way to gather
stats of service popularity.
Another interesting part might be to check for domains with wildcard domains like this:
GET certstream/_search
{
  "size": 0,
  "aggs": {
    "by_domain": {
      "terms": {
        "field": "leaf_cert.all_domains.keyword",
        "include": "\\*\\..*",
        "size": 100
      }
    }
  }
}
A third common use-case might be to search for domain names, that look
similar to known ones, that might be used for fishing attempts. We need to
fix our mapping for this first. The leaf_cert.all_domains is a text and
keyword field. This is OK for full text search, however this would mean that
a domain like *.us-west-2.es.amazonaws.com gets analyzed like this
GET _analyze?filter_path=**.token
{
  "text": [ "*.us-west-2.es.amazonaws.com"]
}
returns
{
  "tokens" : [
    {
      "token" : "us"
    },
    {
      "token" : "west"
    },
    {
      "token" : "2"
    },
    {
      "token" : "es.amazonaws.com"
    }
  ]
}
This is nothing that we can practically search for. An idea to solve this
could be to have another script processor, that indices the last two and
three parts of a domain, i.e. elastic.c and elastic.co.uk. This could be
indexed into a text field and then used in combination with a fuzzy search,
so that typo squatting domains could be found. Let’s try this out:
PUT _ingest/pipeline/certstream
{
  "processors": [
    {
      "script": {
        "source": """
        if (ctx.containsKey('data')) {
          ctx.putAll(ctx.remove('data'))
        }
        """
      }
    },
    {
      "script": {
        "source": """
          ctx.tlds = new HashSet();
          ctx.leaf_cert.all_domains.each(d -> {
            def lastIndex = d.lastIndexOf('.');
            def secondLastIndex = d.lastIndexOf('.', lastIndex-1);
            ctx.tlds.add(d.substring(secondLastIndex+1));

            def tld = d.substring(lastIndex+1);
            if (!['com', 'de', 'org', 'net', 'fr'].contains(tld)) {
              def thirdLastIndex = d.lastIndexOf('.', secondLastIndex-1);
              ctx.tlds.add(d.substring(thirdLastIndex+1));
            }
            return ctx.tlds;
          });
        """
      }
    }
  ]
}
We could reduce this to a single script, which makes sense for performance reasons. This is just for readability.
The next step is to keep indexing data and wait… and every now and then run a query with a well known domain that is a potential fishing target like this:
GET certstream/_search
{
  "query": {
    "bool": {
      "must_not": [
        {
          "match": {
            "tlds": "amazon.com"
          }
        }
      ],
      "must": [
        {
          "match": {
            "tlds": {
              "query": "amazon.com",
              "fuzziness": 2
            }
          }
        }
      ]
    }
  }
}
The query excludes the original domain name, but is included in those with a fuzzy distance to them.
One thing I found during my tests was the creation of a cert for the domain
medstarheaalth.org - which clearly contains a typo..
The last thing to take a look are weird domain names like
"tlds" : [
  "1kl.vip",
  "883kl.com",
  "887kl.com",
  "618kl.com",
  "882kl.com",
  "1233.app",
  "138kl.com",
  "9kl.vip",
  "1369.app",
  "881kl.com"
]
I don’t think those are meant for human consumption. Could be a legit reason, could be a bot net.. you never know. You could set up a job to search for domain names that contain of at least 3 numbers in combination with some other rules.
Also you can search for things like synology names for the synology.me
domain.
You can see, that there are a lot of things to learn from that data, if you dig a little longer.
Summary
Lens has become the default way to visualize data in the Elastic Stack. With each release it has become more powerful and gained new features like time shifting or formulas, or new ways of visualizing data.
The certstream data is medium sized and keeping it for longer would require some more machines than your desktop system. You will easily hit more than 10GB of data per day. It’s also a great live demo data set as it has its fair share of traffic.
The data itself is interesting to gather stats from services run or search for domains potentially used for fraud activities - as they need a trusted TLS certs.
Also you could start to rollup the data, once you hit a certain size and just want to keep statistics.
Final note: Stay up to date with Kibana, there are still a lot of changes and extension to Lens, so make sure you try out at the latest version to not miss any new functionality!
Resources
- Elasticsearch Data Streams Explained
- CertStream
- Kibana documentation: Analyze time series data
Final remarks
If you made it down here, wooow! Thanks for sticking with me. You can follow or ping me on twitter, GitHub or reach me via Email (just to tell me, you read this whole thing :-).
If there is anything to correct, drop me a note, and I am happy to do so and append to this post!
Same applies for questions. If you have question, go ahead and ask!
If you want me to speak about this, drop me an email!