 Alexander Reelsen
Tracking my meeting time with Hammerspoon
TLDR; If you have a lot of meetings as an IC (individual contributor), you’re often feeling less productive. Sometimes it’s true, sometimes those meetings are necessary. I still would like to know, how much time I really spent in meetings during my working hours. This blog post shows how to use Hammerspoon to figure this out.
What is a meeting?
This is already hard to define. Is your monthly all hands a meeting? Probably. Is your daily a meeting? Totally. Are regular 1:1’s with team members a meeting? Absolutely. Is the spontaneous production outage where you gather with everyone a meeting? I’d say so! Your manager calling? Meeting! You typing furiously? Maybe. You watching YouTube? Not so much! You reading email? Nah.
What do all these meetings have in common, if you are working remote? For me: an enabled camera! I always have the camera on, when there is a meeting. It’s important to see my reaction, and the more diverse cultures and persons are in your team, facial expressions, gestures are much more helpful cues than spoken language, especially if you’re not a native speaker.
So, how can I track and figure out, whenever my camera is on?
Hammerspoon to the rescue!
Hammerspoon keeps being my swiss army knife. I used it for for resizing my windows via keyboard shortcuts, muting on wake, or changed keyboard layouts depending if an external keyboard was connected. I also blogged about enabling my lighting when the camera is turned on and enabling DnD mode when sharing my screen some time ago.
So, Hammerspoon basically has all the APIs available. A listener on camera activation and deactivation. The other part is writing a log entry. I want to write an entry every time the camera turns on or the camera turns off into a file. Keeping the state in hammerspoon would go away when reloading and having a file means you could do manual changes if needed - or have another component write into it as well.
function configureAllCameraPropertyWatchers()
  local allCameras = hs.camera.allCameras()
  for k, camera in pairs(allCameras) do
    if camera:isPropertyWatcherRunning() then
      camera:stopPropertyWatcher()
    end

    camera:setPropertyWatcherCallback(function(camera, property, scope, element)
      logCamera()
    end)
    camera:startPropertyWatcher()
  end
end

hs.camera.setWatcherCallback(configureAllCameraPropertyWatchers)
hs.camera.startWatcher()
This code is running the configureAllCameraPropertyWatchers() method on
any camera change. Within that method, for each existing camera a so called
property watcher is installed, after uninstalling first. This watcher calls
logCamera, which looks like this:
function logCamera()
  local anyCameraInUse = false
  local allCameras = hs.camera.allCameras()
  for k, camera in pairs(allCameras) do
    if camera:isInUse() then
      anyCameraInUse = true
    end
  end

  -- add to monthly logging file so we can trace how much time we spent in video sessions
  filename=os.date(os.getenv("HOME") .. '/.hammerspoon/camera-%Y-%m.log')
  file = io.open(filename, "a")
  if anyCameraInUse then
    file:write(string.format('%s ON\n', os.date('%Y-%m-%dT%H:%M:%S')))
  else
    file:write(string.format('%s OFF\n', os.date('%Y-%m-%dT%H:%M:%S')))
  end
  file:close()
end
If any camera is in use, this piece of code writes the date and either ON
or OFF and appends it into a log file named camera-2024-09.log. Given
that my work day only has 8 hours, and about 20 days a month, even with 10
meetings a day, the amount of data is reasonable small, like a couple of
hundred lines, max.
OK, so now we have entries like this in the log
2024-09-13T09:00:40 ON
2024-09-13T09:46:00 OFF
Parsing the log file
In general, we can consider a ON event followed by an OFF event a
Session with a duration, that is the end date minus the start date.
What corner cases can be encountered:
- A very long event could be a missing
ONorOFFevent and thus is not valid. Any meeting exceeding 3h should fall into that category. - A very short meeting. I only count meetings longer than a minute, so that camera testing, calibration or similar do not fall into this category.
- Two
OFFevents after another. Nothing to do here. - Two
ONevents after another. For safety I’d go with the latestONevent and check for the nextOFFevent, even though I may miss meeting times. Worst case, I could fill up the log file manually.
So, how to parse this wonderful piece of a log file? Pretty much everything.
I think I could even come up with a small awk script if needed. I choose
Crystal however. Let’s start with the
describing objects:
enum State
  OFF
  ON
end

class Session

  getter duration : Time::Span

  def initialize(@end : Time, @start : Time)
    @duration = @end - @start
  end

  def to_s(io : IO)
    io << @start.to_s("%F %T") << " - " << @end.to_s("%T") << ", took  " << @duration
  end
end
With this, let’s read the log file, that is parsed as an argument
lines = File.read_lines(ARGV[0])
previous_state = State::OFF
start_time = Time.utc
sessions = Array(Session).new

lines.each do |line|
  if line.empty?
    next
  end

  time,parsed_state = line.split(2)
  current_state = State.parse parsed_state

  if current_state == State::ON
    start_time = Time.parse(time, "%Y-%m-%dT%H:%M:%S", Time::Location::UTC)
  elsif current_state == State::OFF && previous_state == State::OFF  # noop here
  elsif current_state == State::OFF && previous_state == State::ON   # jumped from ON to OFF
    end_time = Time.parse(time, "%Y-%m-%dT%H:%M:%S", Time::Location::UTC)
    session = Session.new end_time, start_time
    # let's not add short tests...
    if session.duration > 1.minute
      sessions << session
    end
  end
  previous_state = current_state
end
Now with a list of sessions we can do our fancy calculations
duration_total_minutes = sessions.map &.duration.total_minutes.to_i
days_with_meetings = sessions.map { |session| session.@end.at_beginning_of_day }.uniq.size

duration_minutes_sum = duration_total_minutes.sum
meeting_time_per_day = duration_minutes_sum // days_with_meetings

duration_hours = duration_minutes_sum // 60
duration_minutes = duration_minutes_sum % 60

STDOUT.print "Total meeting time: #{duration_hours}:#{duration_minutes}h (#{duration_minutes_sum} minutes)\n"
STDOUT.print "Days with meetings: #{days_with_meetings}\n"
STDOUT.print "Average Meeting duration per day: #{meeting_time_per_day} min\n"
The // operator in Crystal might be the least known here, which is a floor
division, so 100//8 == 12 returning an integer instead of a float.
The output looks like this:
Total meeting time: 38:15h (2295 minutes)
Days with meetings: 15
Average Meeting duration per day: 153 min
So, 2.5h of meetings per day. That’s a bit I guess. Of course that number alone is worthless without more long term data and trends.
Diving deeper
While this is a good start, of course the next step is to dive deeper. Let’s first change the crystal parser to output the sessions as a CSV, start date and time, end date and time and duration.
Let’s try this piece of code to write some CSV data:
result = CSV.build do |csv|
  sessions.sort! { |a, b| a.@end <=> b.@end }
  sessions.each { |session|
    csv.row session.@start.to_rfc3339, session.@end.to_rfc3339, session.@end.to_s("%F"), session.@end.time_of_day, session.@end.day_of_
week, session.duration.total_minutes.round.to_i
  }
end

STDOUT.print result
With a CSV file, we have a lot of possibilities, for example using datamash and youplot we can take a look at the duration per day
crystal parser.cr camera-2024-09.log \
  | datamash groupby 3 sum 6 -t, \
  | uplot bar -d,
results in
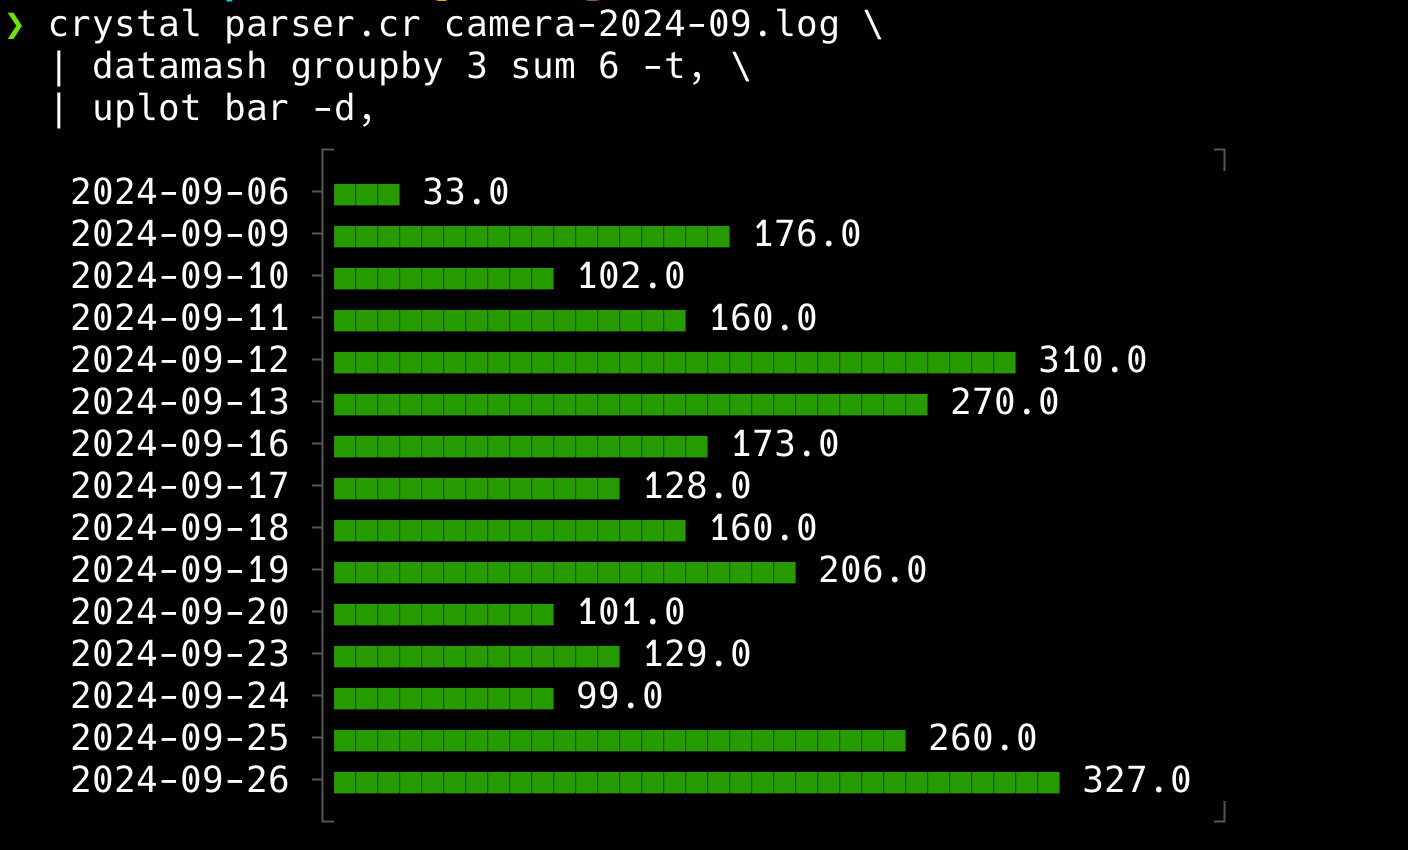
I promise the last day of the chart I held a workshop 😀
This chart summed up the use per day. Let’s find out which day of the week is most meeting heavy. Given our CSV entries we need to sum up all the meeting minutes and group by weekday, however we also need to divide by the amount of different occurring weekdays.
Turns out this is not so easy with a single datamash call. I am not a power user, so I started add maximum confusion by chaining as many UNIX tools together that I could find
crystal parser.cr camera-2024-09.log \
  # sum minutes for each date
  | datamash -t, groupby 3,5 sum 6 \
  # sum for each day and count number of days
  | datamash -s -t, groupby 2 sum 3 count 2 \
  # divide sum by the count
  | awk -F, '{ printf "%s,%i\n", $1,$2/$3  }' \
  # sort by calculated value
  | sort -t, -n -k 2 \
  # plot
  | youplot -d, bar
Returns:
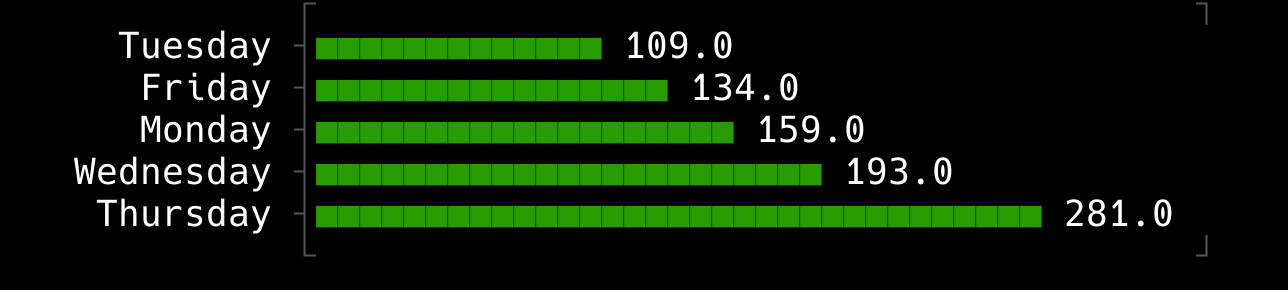
This makes sense, as I am holding a longer workshop on Thursday at the moment.
Lastly I would like to see a trend over time. Am I doing more meetings or less? While I could see that in the first graph, a daily view is too spiky. Would a moving average work? Or would the sum of weekly meetings be a good enough indicator? Cutting the date by year and month is a little tricky, so the week of the year might be a better indicator. We could just add that one in the crystal parser like this by adding another column:
csv.row session.@start.to_rfc3339,
        session.@end.to_rfc3339,
        session.@end.to_s("%F"),
        session.@end.time_of_day,
        session.@end.day_of_week,
        session.duration.total_minutes.round.to_i,
        session.@end.calendar_week.join("-")
And then use that column to group by and sum minutes up:
crystal parser.cr camera-2024-09.log \
  | datamash -t, groupby 7 sum 6 \
  | tr '-' '.' \
  | uplot -d, line
Turns out, that uplot expects numbers on the x and y axis. I did an ugly
hack here and converted 2024-35 into 2024.35, but this will only work
until a year flips over, then numbers jump from X.52 to Y.01. Not a good
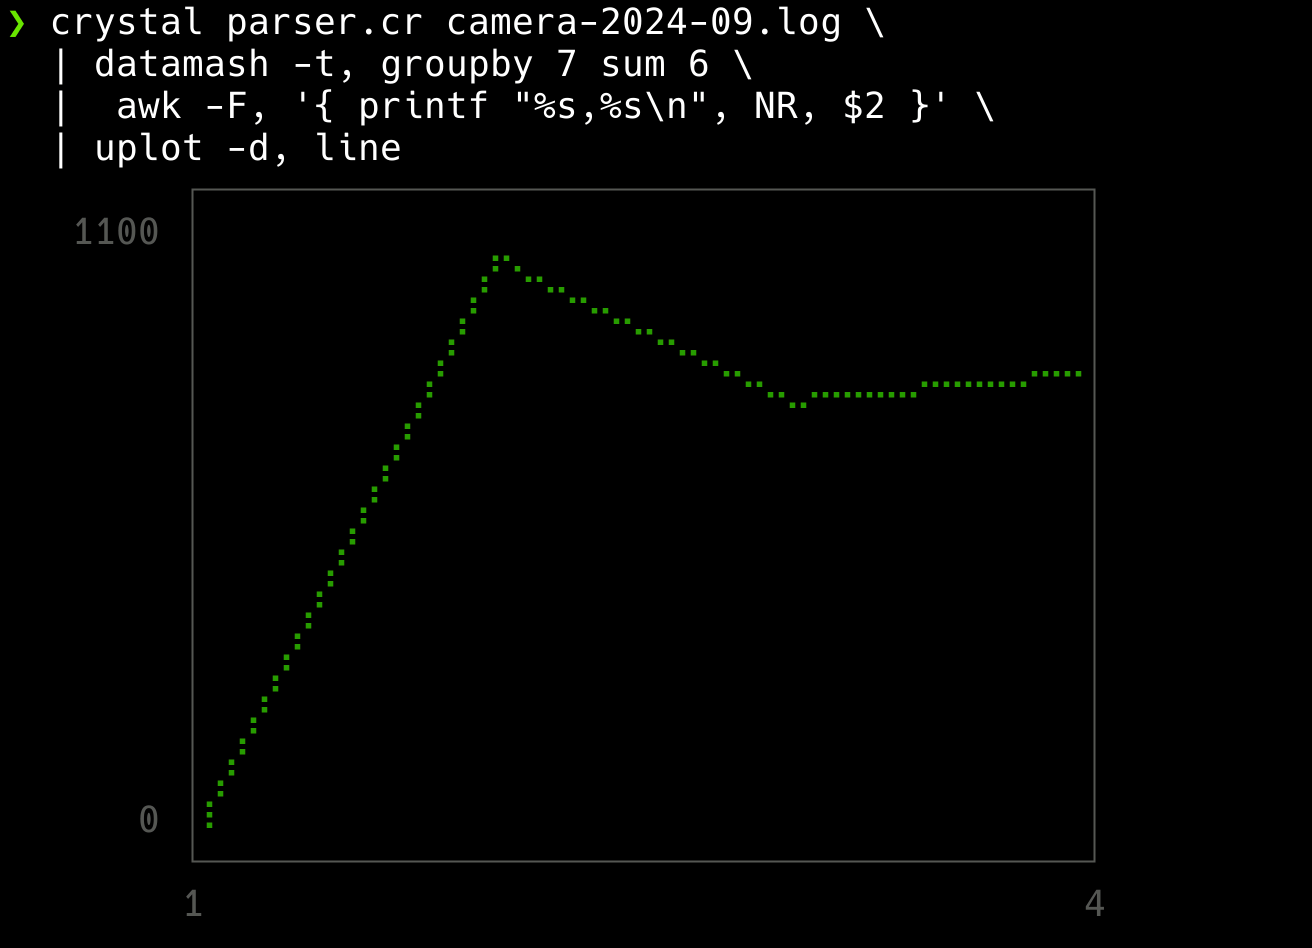
idea. Turns out we can replace the current week with an index using awk
via
crystal parser.cr camera-2024-09.log \
  | datamash -t, groupby 7 sum 6 \
  | awk -F, '{ printf "%s,%s\n", NR, $2 }' \
  | uplot -d, line
Now the following graph is shown. As I’ve only been tracking since three weeks, so this is a little useless and the first week has only got 30 minutes of meetings.
Summary
I found a mechanism to log my camera usage. I probably could have also
tinkered with log stream | grep -i camera and its variants, but as I am a
heavy hammerspoon user already, that seemed fine for me.
I am also not yet sure what to conclude of the data, I will keep collecting for now. My goal might be to have dense meeting days or reduce the total amount of meetings or at least have a block of focused work time.
If you have more ideas, what to do with this data, I am all ears :-)
Resources
- Hammerspoon: hs.camera API
- YouPlot: GitHub
- Datamash: Homepage
- mlr: Homepage, another tool to deal with CSV data, but not used here
Final remarks
If you made it down here, wooow! Thanks for sticking with me. You can follow or contact me on mastodon, GitHub, LinkedIn or reach me via Email (just to tell me, you read this whole thing :-).
If there is anything to correct, drop me a note, and I am happy to fix and append a note to this post!
Same applies for questions. If you have question, go ahead and ask!
If you want me to speak about this, drop me an email!